The Hostinger Ecommerce Analytics page tracks your store’s sales and traffic performance in one place, split into a Sales tab and a Traffic tab. Use the Sales tab to see total sales, orders, average order value, and which channels, products, and discounts drive results. Use the Traffic tab to see visits, unique visitors, and where visitors come from by channel, country, and device. Both tabs share the same date range, comparison, and filter controls.
Open a store’s Store Manager, then select Analytics in the sidebar to open the Sales and Traffic tabs.
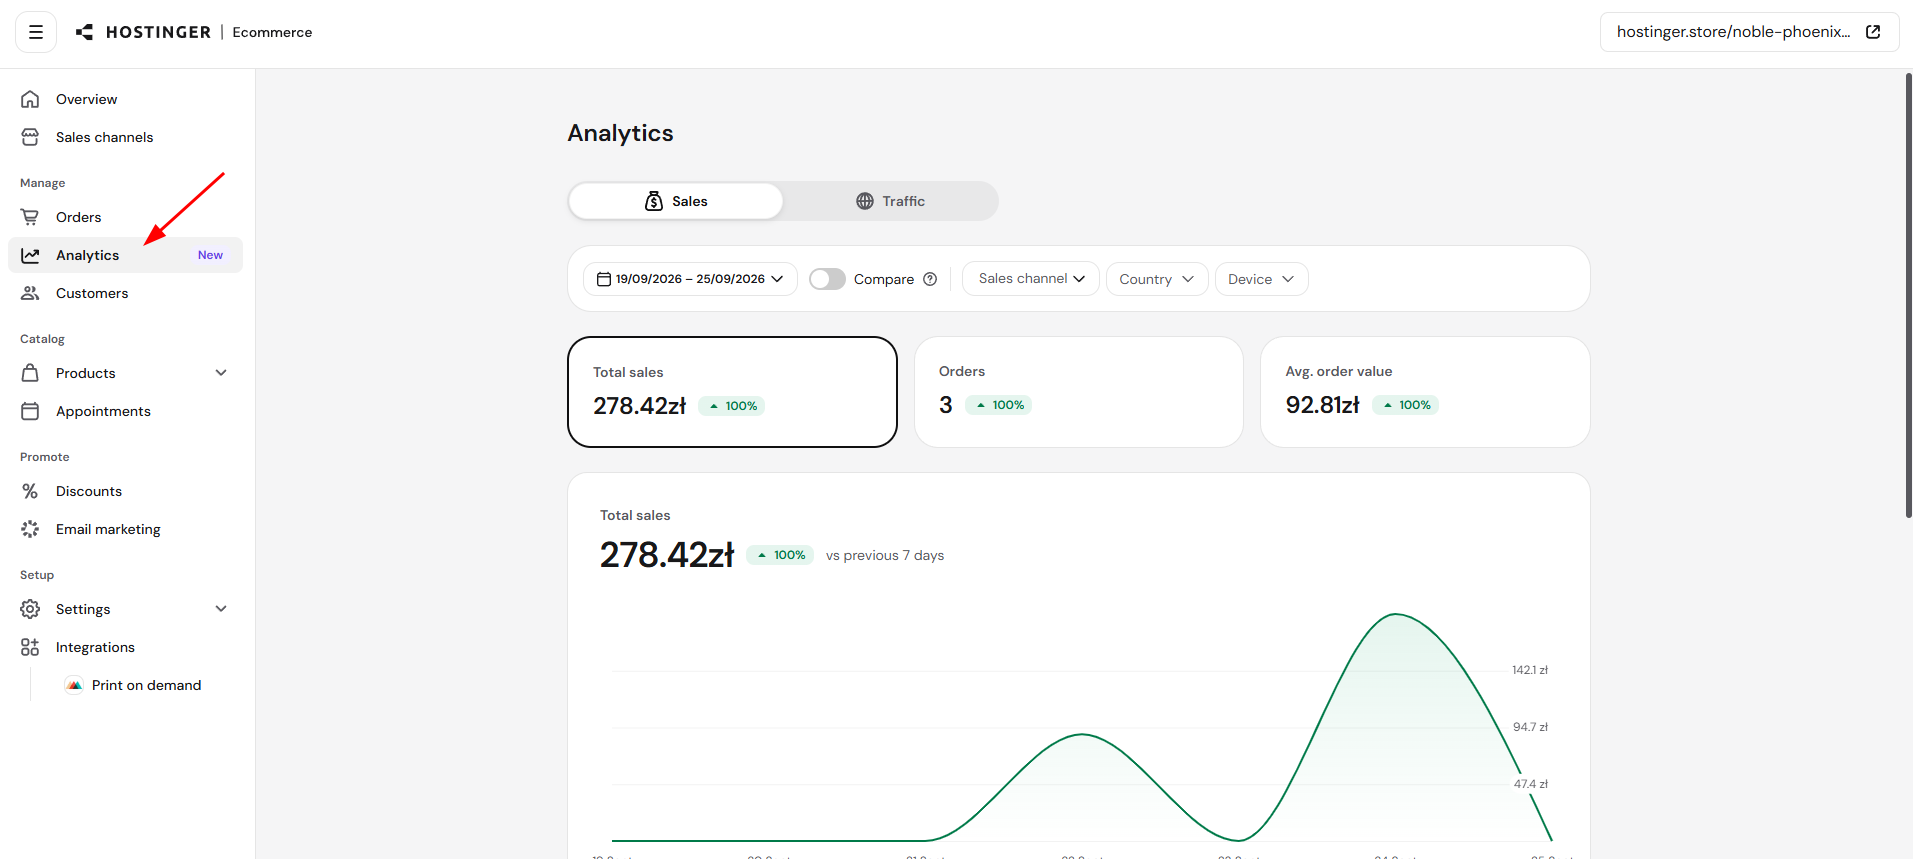
View sales performance in the Analytics page
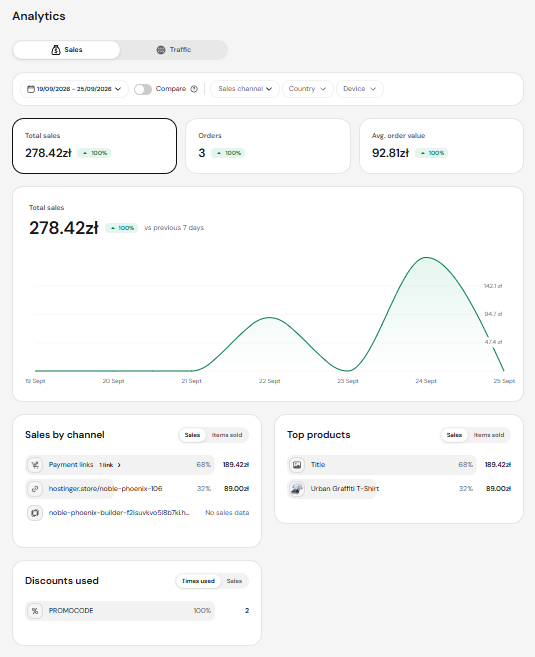
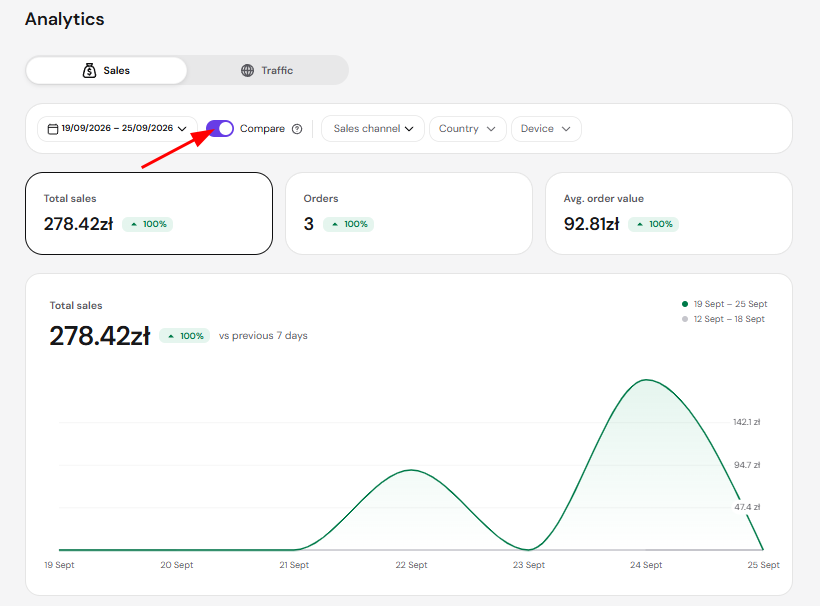
The Sales tab reports total sales, the number of orders, and the average order value for the selected period, each with a badge showing the percentage change from the previous period. A line chart plots the selected date range by day below the summary cards.
Below the chart, three panels break down what drove those results:
- Sales by channel shows the share of sales from each connected sales channel.
- Top products lists your best-selling products by sales or items sold.
- Discounts used lists each applied discount code, its number of uses, and its share of sales.
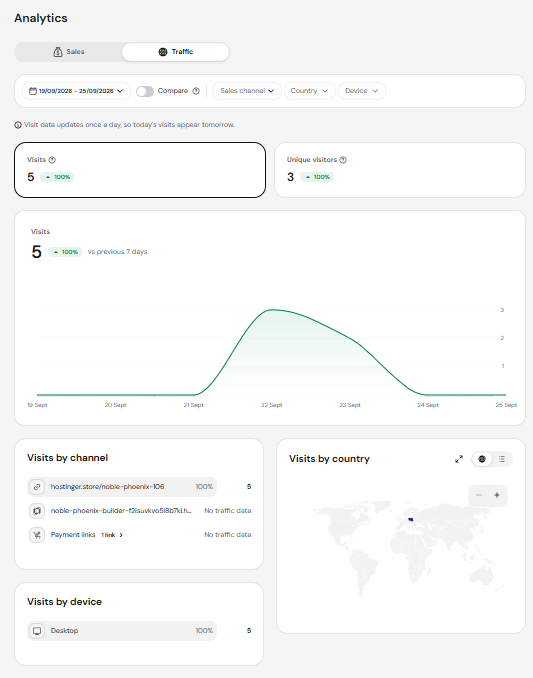
View traffic performance in the Analytics page
Select Traffic next to Sales at the top of the Analytics page to switch tabs. The Traffic tab reports visits and unique visitors for the selected period, each with a comparison badge, plotted on a line chart by day below the summary cards.
Below the chart, three panels break down where visits came from:
- Visits by channel shows visits from each connected sales channel.
- Visits by country shows visits by country as an interactive map or as a list; toggle between the two using the icons above the panel.
- Visits by device shows the share of visits from desktop, mobile, tablet, and other devices.
NOTES
- Traffic data updates once a day, so today’s visits appear tomorrow.
- Sales channels such as TikTok Shop, Meta, and custom channels don’t share traffic data with the Traffic tab. The Sales tab reports sales for all connected channels regardless of this limitation.
Filter and compare Analytics data
Use the filter bar at the top of either tab to narrow the data. The same filters apply whether you’re viewing the Sales tab or the Traffic tab.
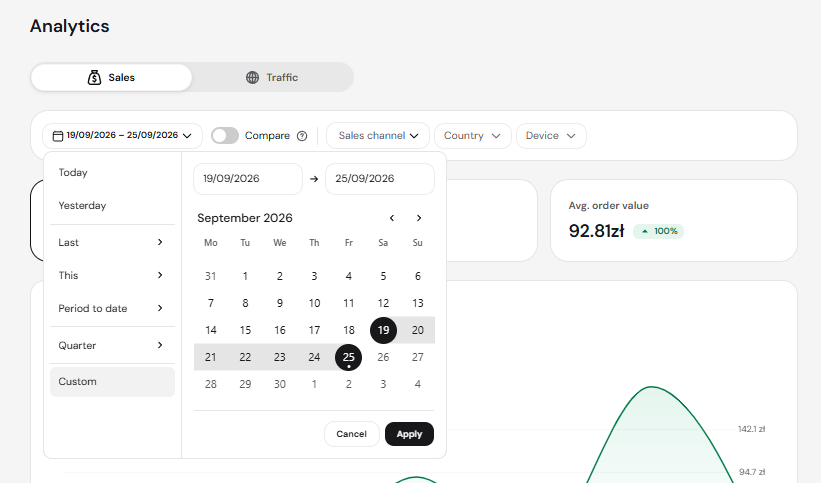
- Date range – Choose a preset such as Today, Yesterday, a recent number of days, this or last week/month/quarter/year, or a specific past quarter, or select Custom to pick any range up to 365 days.

- Compare – Toggle Compare to overlay the previous period of equal length on the chart and add a percentage change badge to each summary metric.

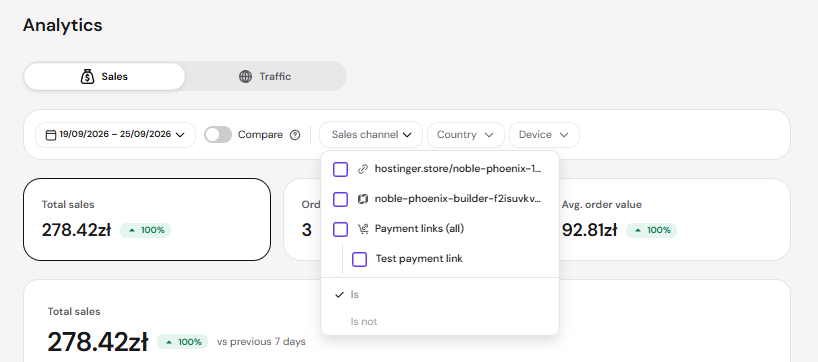
- Sales channel – Filter by one or more connected sales channels with an Is or Is not condition.

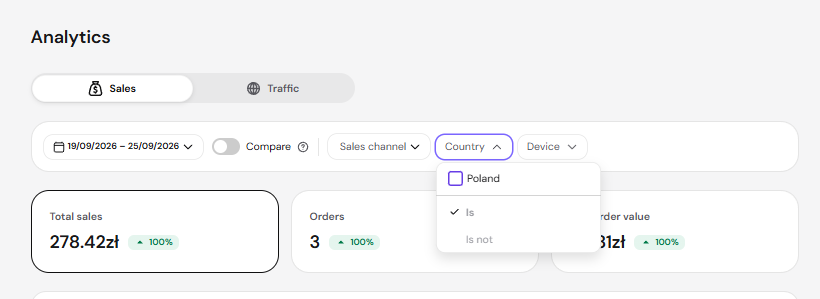
- Country – Filter by one or more countries with an Is or Is not condition.

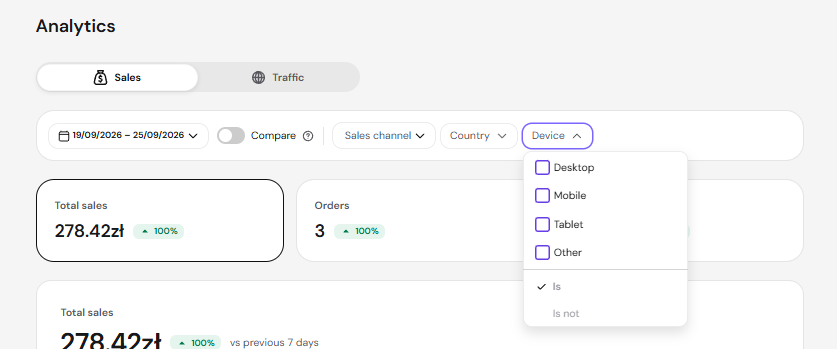
- Device – Filter by one or more device types with an Is or Is not condition.

With sales and traffic in one place, you can see which channels, products, and discounts are actually driving results without switching between separate reports.