Hostinger AI Builder manual mode includes a built-in analytics tool that shows detailed insights into who visits your website, so you can tailor your content more effectively to suit your audience.
To see the traffic overview, your website must be published. The first data is available one hour after publishing the website. The data is automatically updated every 24 hours.
Check traffic in the editor
Within the builder, click ellipsis menu in the top left then choose Analytics:
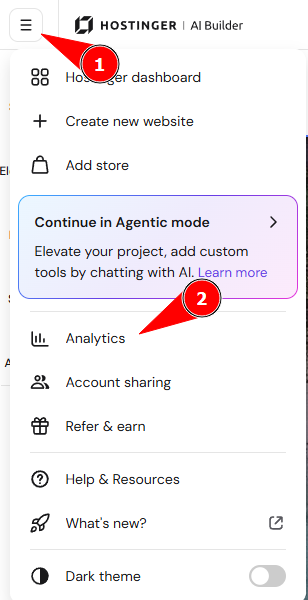
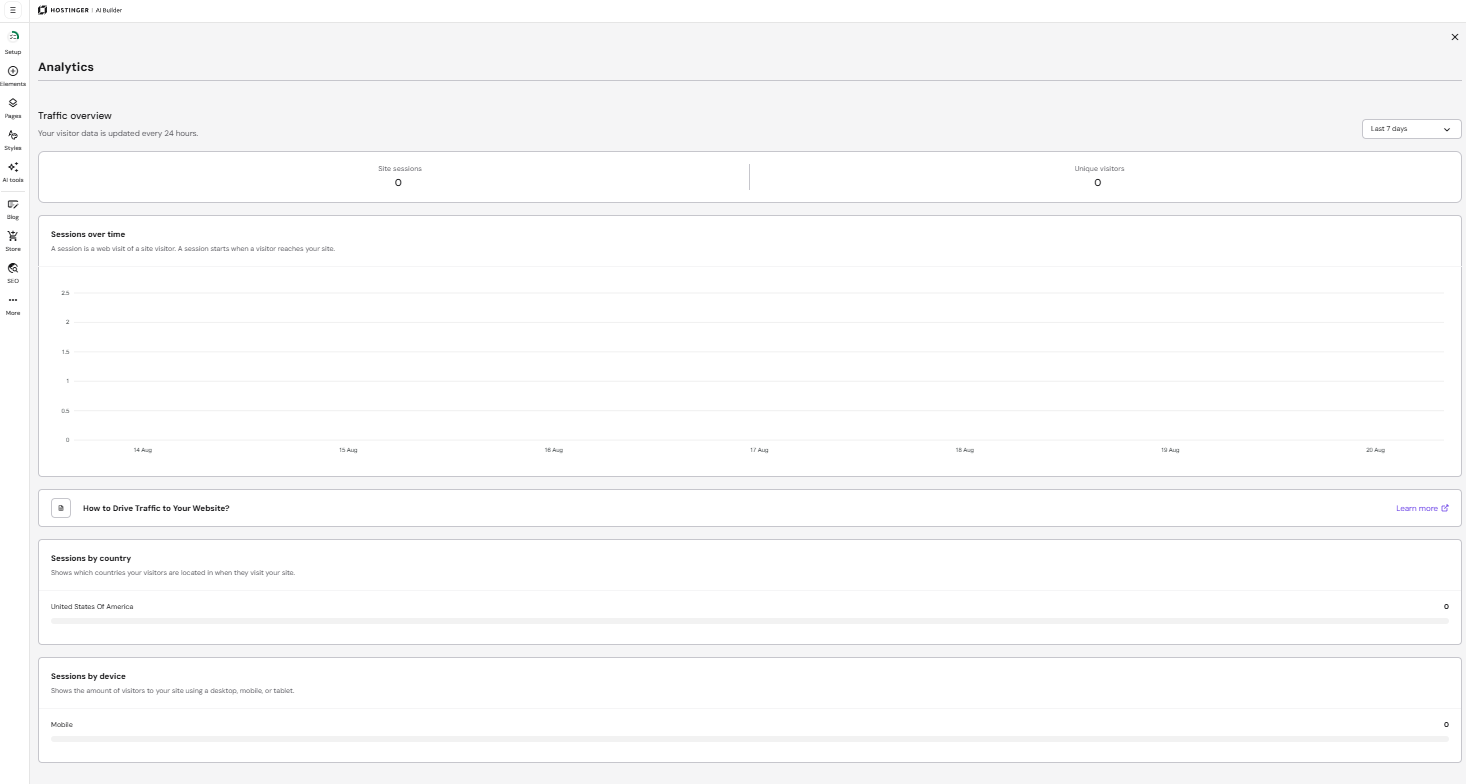
There, you can see the following sessions:
|
Over time |
By country |
By device |
|
Last three, seven, or 30 days It shows both total sessions (including search engine bots) and the number of unique visitors |
Check what countries your visitors are from |
Desktop vs. mobile |
The Analytics tool collects data through Cloudflare CDN and doesn’t use any cookies or third-party integrations. If you need more detailed tracking, such as user behavior or conversion events, you can also connect Google Analytics to your website. In other words, this tool doesn’t require visitor’s consent and is irrelevant to mention in your Privacy policy because:
-
It doesn’t collect any personal data
-
The collected data is only used for traffic overview
-
The collected data is not shared or connected with data from other websites
Check traffic from the Hostinger dashboard
In addition to the Analytics panel inside the AI Builder editor, you can now view your site’s traffic data directly from the AI Builder dashboard in Hostinger dashboard — without needing to open the editor.
How to access it
- Log in to Hostinger dashboard
- Go to Websites and find your AI Builder site
- Click Dashboard
- Scroll to the Analytics section on the dashboard
You can also ask the AI assistant directly in the builder editor about your website’s traffic and performance. It can share details like total and unique visitors, your busiest days, the desktop vs. mobile split, and your top visitor countries, all conversationally in the chat.
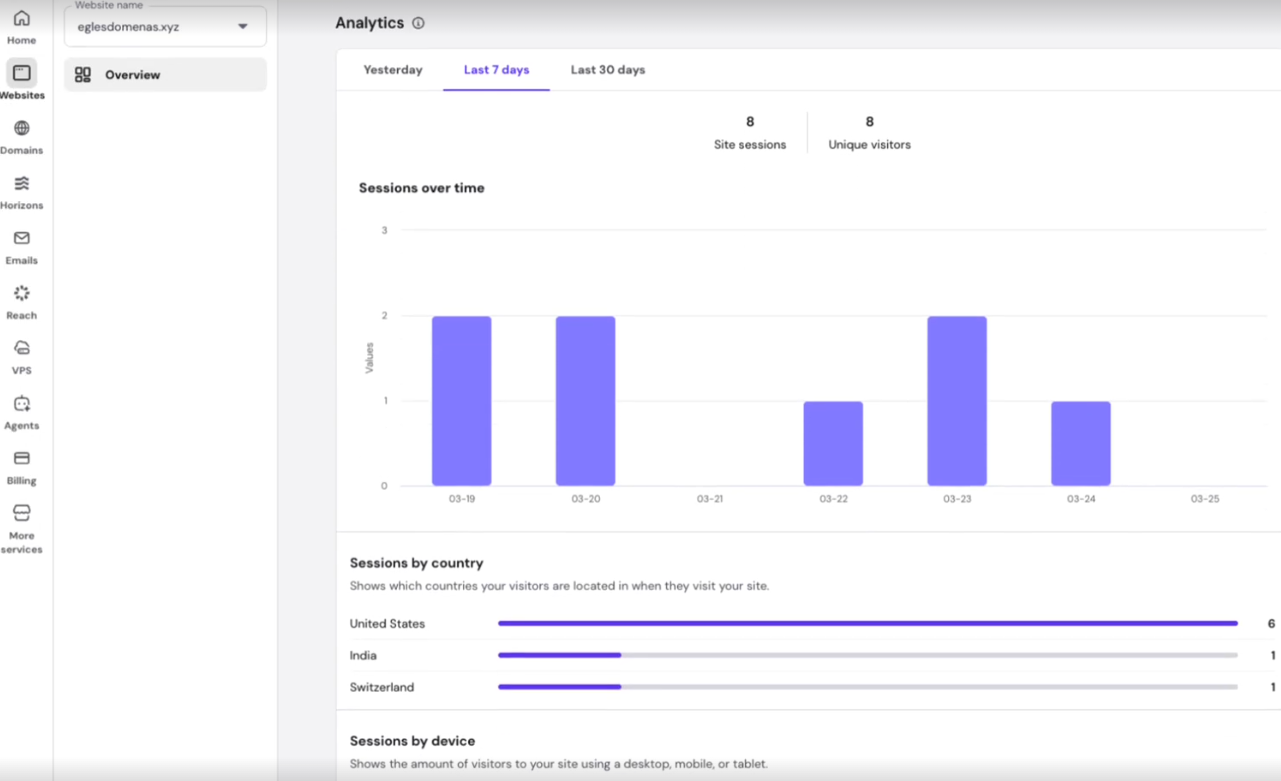
What you can see on the dashboard
- Sessions by country — see which countries your visitors are coming from
- Sessions by device type — desktop vs. mobile breakdown
- Time range filter — view data for the last day, 7, or 30 days
You can also check eCommerce analytics (store users) such as Total Sales, Orders, and Average Order Value for the current month.
That’s it – now you know how to use the Analytics tool and understand its data!