How to inspect element and make temporary changes to any website
Apr 13, 2025
/
Linas L. & Noviantika G.
/
9 min Read
Learning how to inspect elements in a browser is beneficial, especially if you work in IT. Inspect Element lets visitors access and temporarily edit a website’s front-end source code, including its HTML, CSS, JavaScript, and image files.
Aside from temporarily changing the appearance of a website, the Inspect Element tool allows users to test scripts, debug errors, and locate a web page’s metadata.
All major browsers include the Inspect Element feature. This article will demonstrate how to use and access Inspect Element in Google Chrome, Safari, and Mozilla Firefox.
We’ll also go over how to use it, such as how to change a page element, inspect CSS classes, and enable Responsive Design Mode.
Download website launch checklist
What Can You Do With Inspect Element
The Inspect Element feature offers many benefits to users. Here are several things you can do with it:
- CSS live-editing ‒ allows you to make edits in the CSS panel and see the changes in real time.
- Layout testing ‒ lets you test different website layouts.
- Debug diagnostics ‒ helps website maintenance as it can check whether a site contains broken code.
- Temporary editing ‒ allows you to tweak page elements without making permanent changes to the code.
Why Do You Need to Inspect Web Elements
The Inspect Element feature is valuable for many use cases, especially for:
- Web developers – you can test the code you’ve written and interact with it on a web page. You can also use Inspect Element to find errors or bugs on a site.
- Content writers – the Inspect Element feature lets you omit sensitive information from a web page before taking a screenshot. Manipulating a page using Inspect Element is quicker than photo editing software.
- Digital marketers – lets you check a competitor’s search engine optimization (SEO) efforts, website metadata, targeted keywords, and Google index status.
- Customer support agents – helps when assisting web developers in pinpointing and fixing a website error.
- Designers – help modify a site’s design and see the changes before implementing them. The tool also lets you preview the appearance of a web page on a desktop computer or mobile device. This saves time and makes communicating with clients more efficient.
How to Inspect Element Using Chrome Developer Tools
Before exploring the Inspect Element tool in Google Chrome, it’s essential to know about the Developers Tools. It is a panel that comes with the Inspect Tool, and it comprises three main parts:
- Elements/Document Object Model (DOM) panel – contains the page’s DOM tree and provides access to the Hyper Text Markup Language (HTML) source code. It is located at the top taskbar of the Chrome Developer Tools.
- CSS panel – allows you to change, add, and remove CSS properties to modify the style rules of a web page. It is located in the middle section of Developer Tools, under Styles.
- Console – displays logged messages and runs the JavaScript code. It appears at the button taskbar of Developer Tools.
Here’s how to open Inspect Element using Google Chrome:
- Open a website in Google Chrome. We will be using hostinger.com for this tutorial.
- Click on the three vertical dots on Chrome’s top menu bar, choose More tools, then select Developer tools.
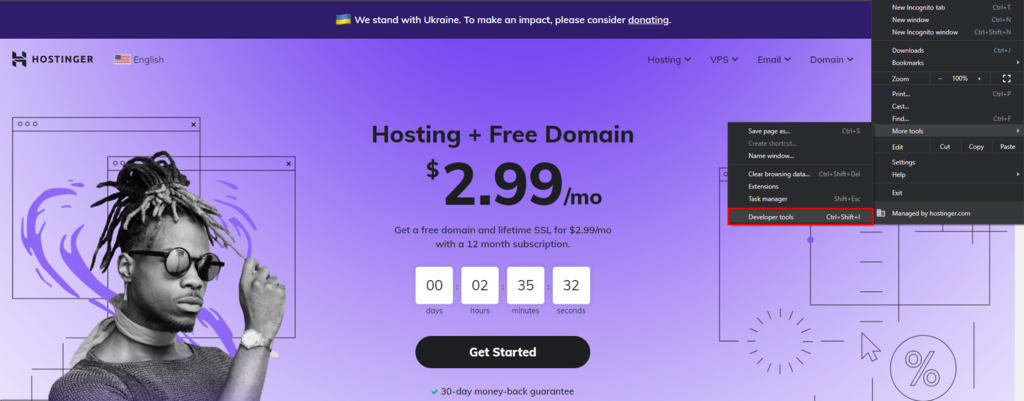
Alternatively, use the keyboard shortcuts – Ctrl + Shift + I for Windows or Linux and Cmd + Option + I for macOS users.
Or, right-click on the web page and choose Inspect to access the Developer tools panel.

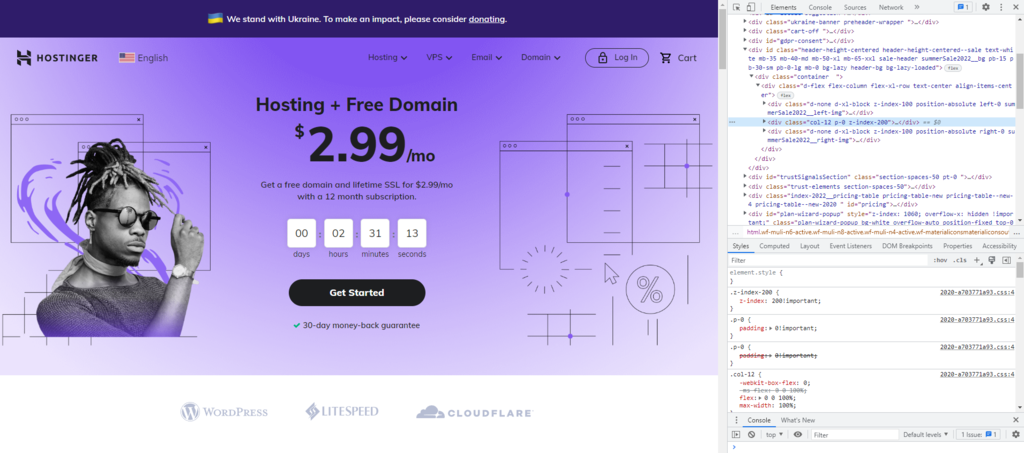
- Once the Elements tab appears on your browser window, you can edit the page’s source code. Resize the inspector box by dragging its corners for better readability.
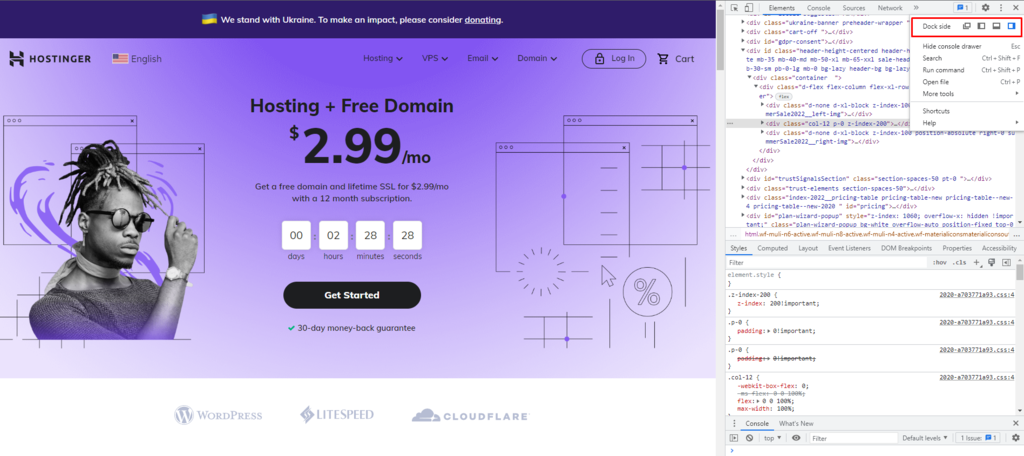
- By default, the Elements panel will appear on the right side of the browser window. If you want to change its location or move it to a separate window, click on the three vertical dots at the upper-right corner of the panel and choose your preferred Dock side setting.
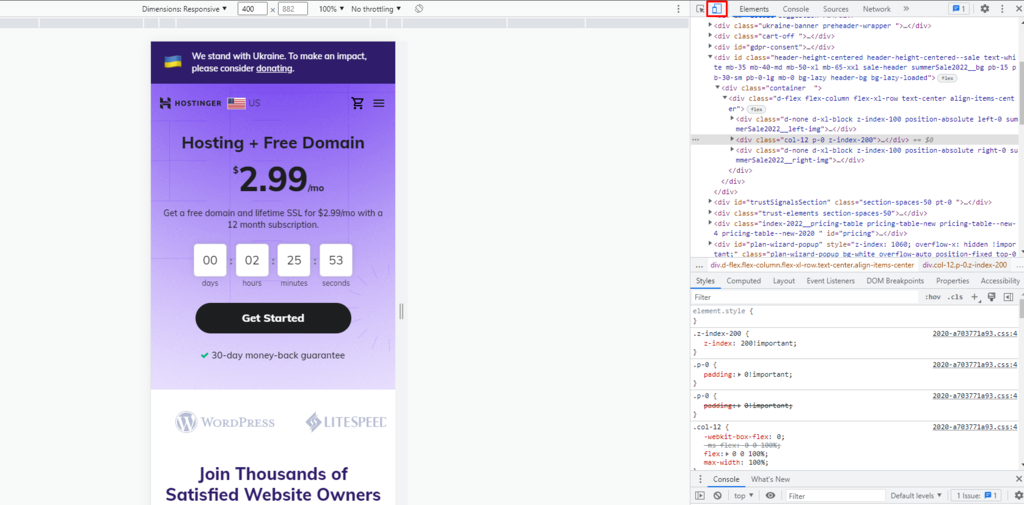
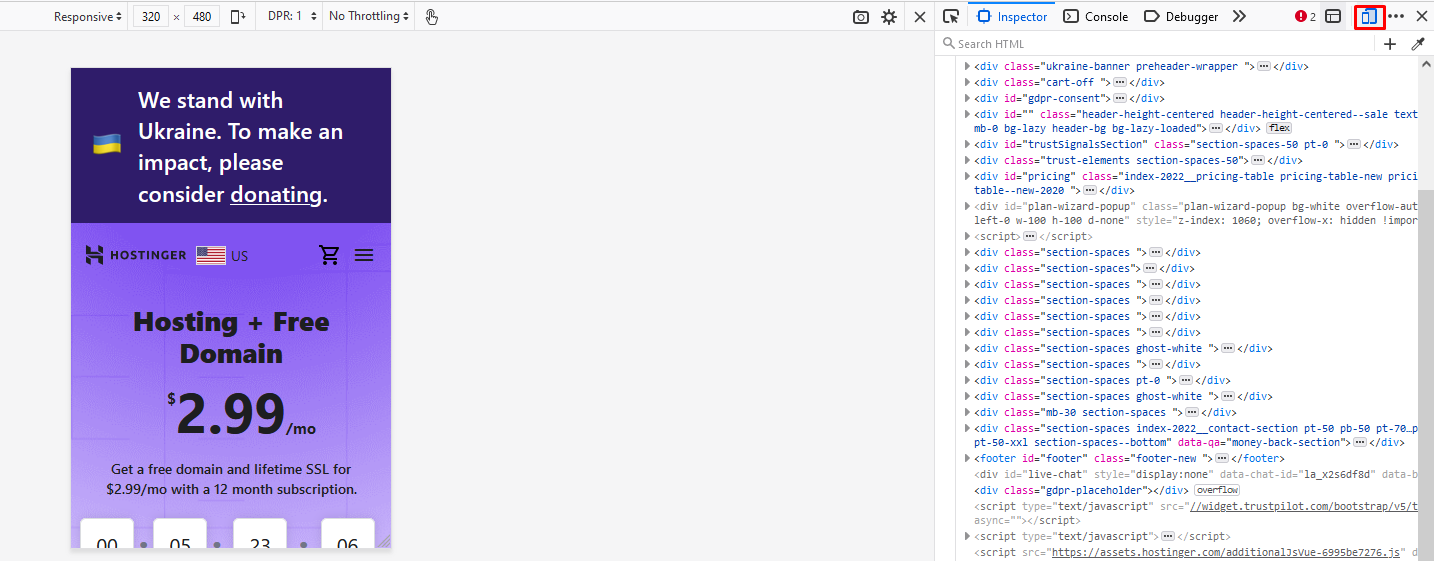
- To see how the web page appears on mobile devices, click the Toggle device toolbar at the top-left corner of the panel. Above the preview, you can change the variables to test how the page performs with a different screen resolution or bandwidth throttling level.
Pro Tip
To inspect a specific element, right-click on it and choose the Inspect option. The inspect element tools will open and automatically highlight the source code of the selected element.
You can use Inspect Element to change, delete, or hide site content and check CSS classes. We recommend clearing the browser cache regularly to ensure you’re viewing the original appearance of the web page.
The following sections will provide in-depth information on how to perform common Inspect Element tasks.

Change an Element
To change a page element, you need to alter the page’s CSS or HTML source code. This way, you can edit text and its style elements, such as font weight, size, and color.
The DOM panel enables simple text modification. Here’s how to do it:
- Open Google Chrome and go to a website. In this example, we’re using hostinger.com.
- Right-click anywhere on the web page and select Inspect to open the Developer tools.
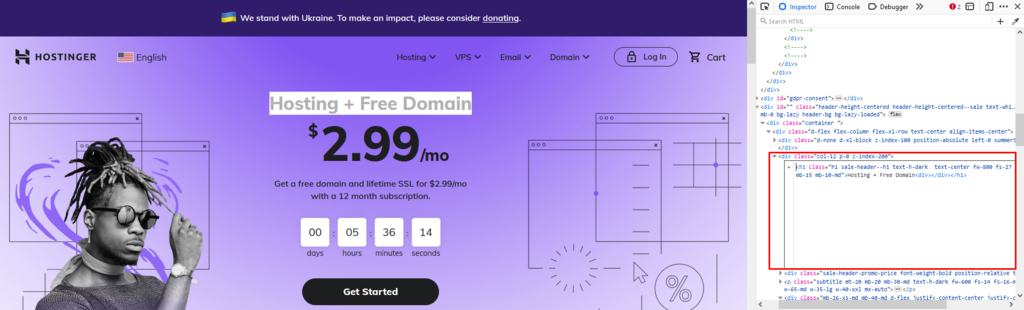
- After opening the Elements box, use the Inspect tool ‒ the cursor icon at the top left of the panel ‒ to highlight the source code element you want to change.
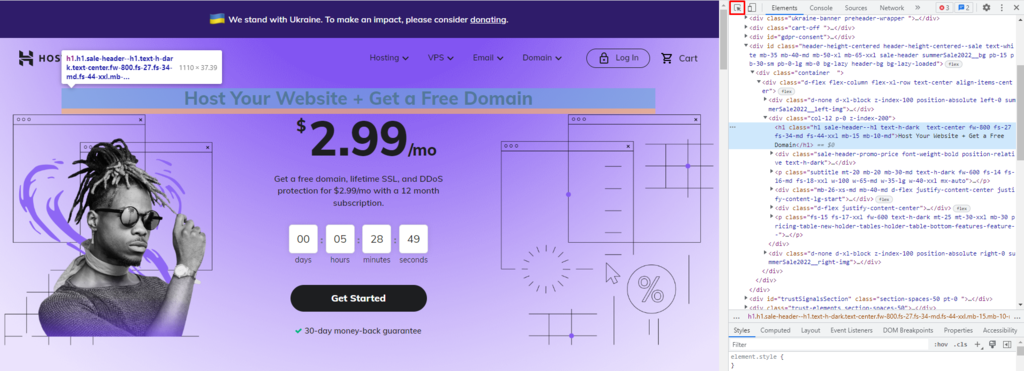
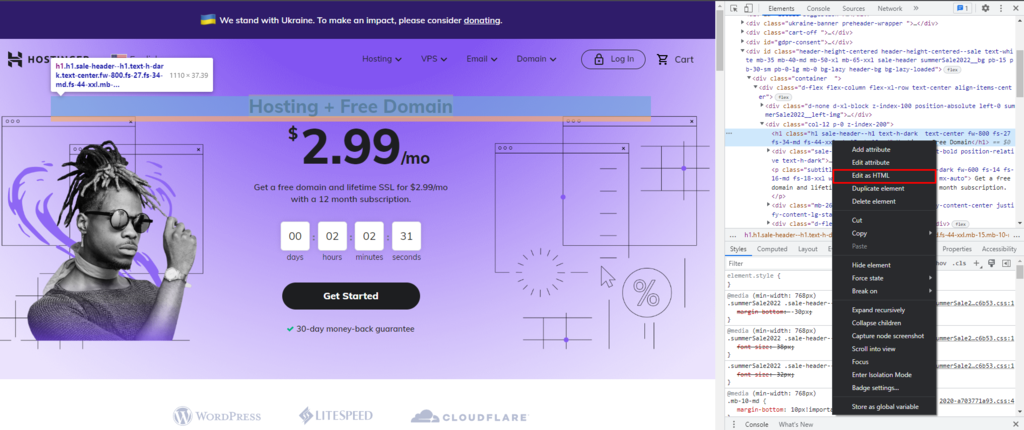
- Right-click on the code highlighted within the DOM tree and select Edit as HTML. Alternatively, double-click the text you want to alter.
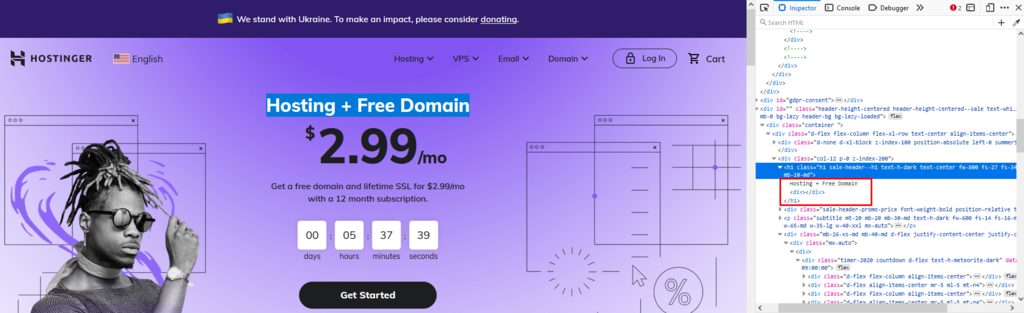
- The editor box will expand, allowing you to modify the text. Text elements are usually encased in quotation marks.
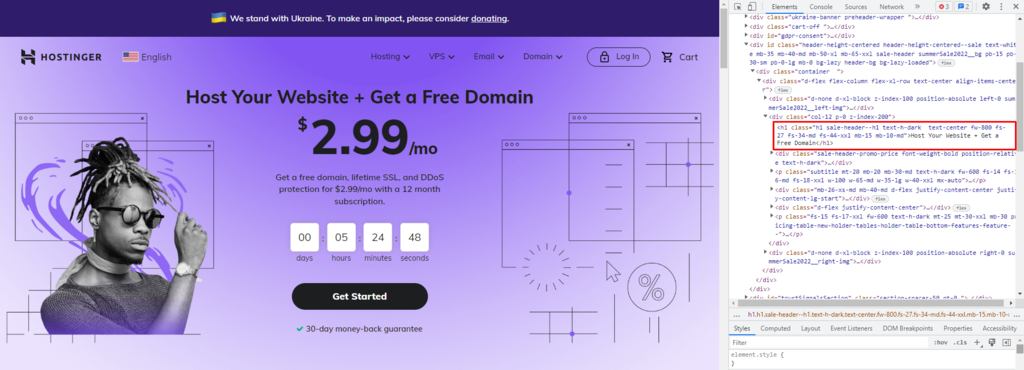
- Deselect the element to preview the changes.

Modifying the style of web elements involves similar steps, but you’ll use the CSS panel instead. We’ll mainly use element.style, which comprises different properties to choose from and add to the web page.
Follow these steps:
- Open Google Chrome and access a website. In this example, we’re using hostinger.com.
- Right-click anywhere on the website and choose Inspect.
- Use the Inspect tool to highlight an element.
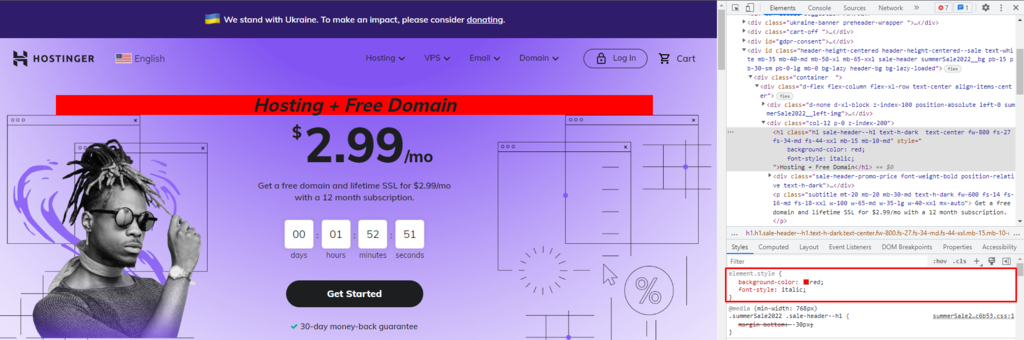
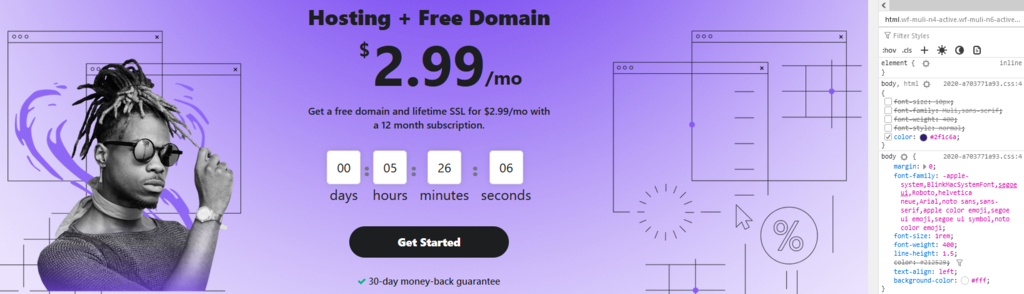
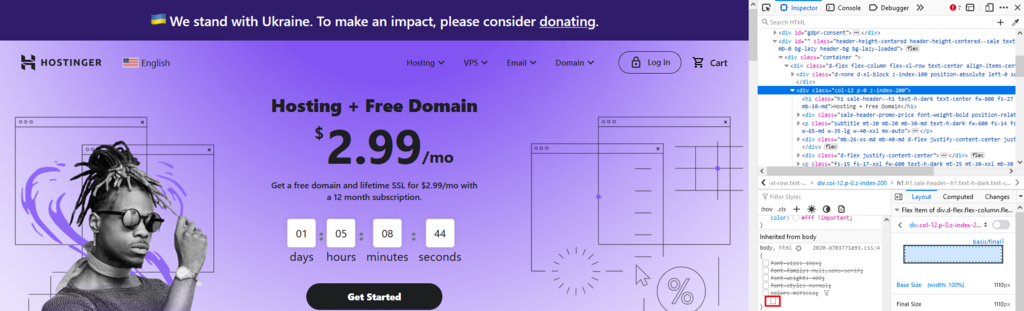
- Click on the element.style property on the upper part of the CSS panel and add the desired style declarations inside the curly brackets. In the following example, we added a background color to a text block:
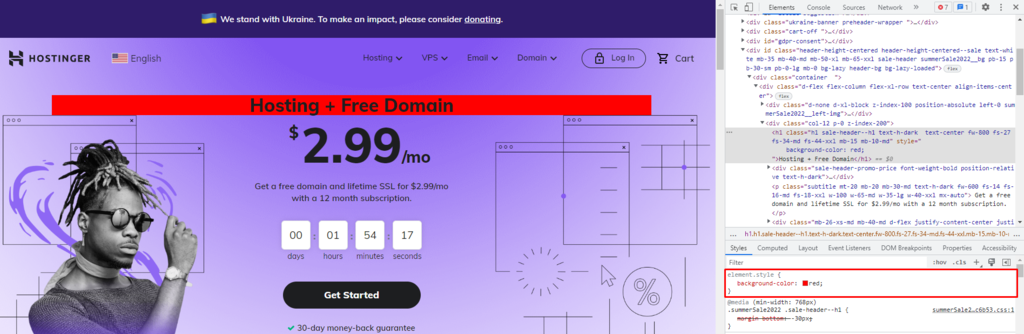
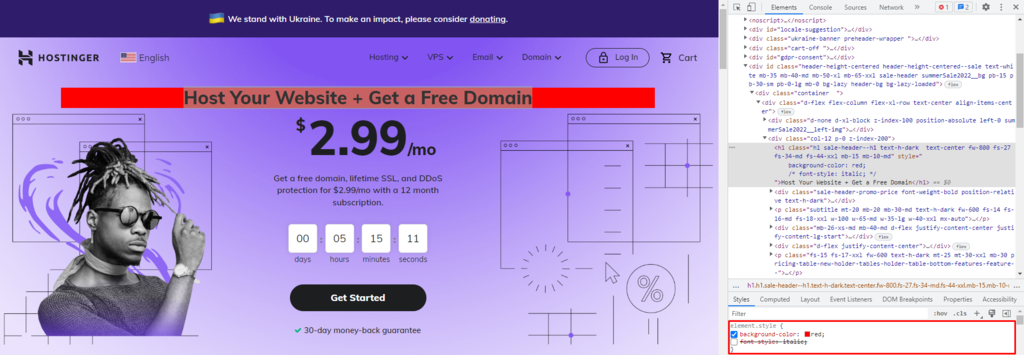
- If you want to put another style declaration, select the element.style property again. The web inspector will add another empty line to fill. Here, we append a second property to display the text in italics:
- Hovering over CSS properties in the panel will reveal a checkbox next to each line. Uncheck it to omit any styles from being shown. Alternatively, you can click on a property or a value to replace it.
Hide or Delete an Element
The Developer Tools also let you hide site elements on web pages. With the Hide Element feature, the CSS panel can create a visibility property to hide any site content without deleting it.
Follow these instructions:
- Open Google Chrome and go to a website. Here, we use hostinger.com.
- Right-click on any part of the web page and select Inspect.
- Enable the Inspect feature and click on the element you want to hide.
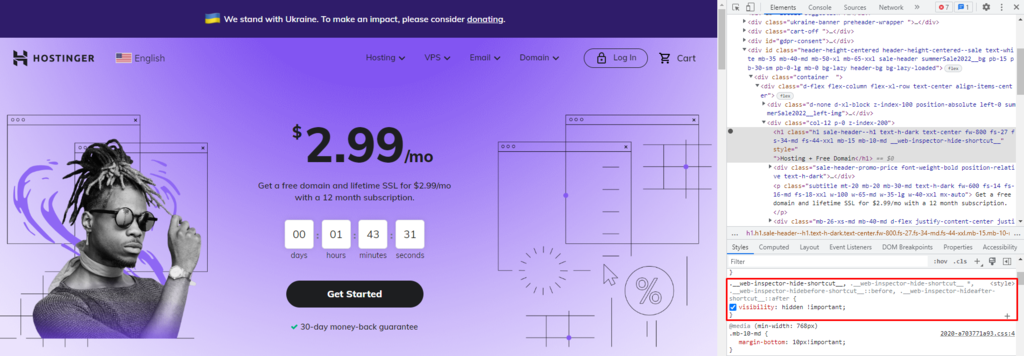
- Right-click on the code highlighted on the DOM tree and select Hide Element. A new visibility property will appear on the CSS panel. Uncheck it to undo the change.
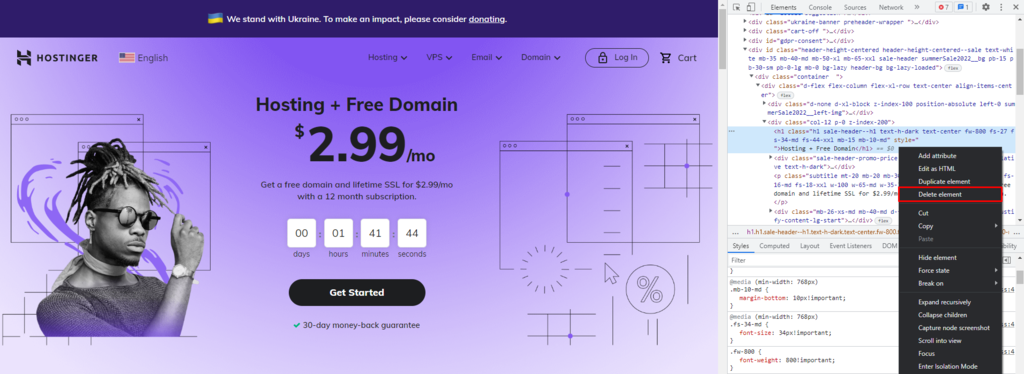
- If you want to remove an HTML element instead, right-click on the highlighted code and select the Delete element. Refreshing the page will restore the removed code.
Pro Tip
You can undo all the changes made in the Inspect Element tool by pressing Ctrl+Z on Windows and Linux or Command+Z on macOS.
Inspect CSS Classes
Inspecting page elements is an excellent way to check web design code. You can also copy them to style your website’s sections using CSS classes.
Here’s how to do it:
- Open Google Chrome and access a website. Here, we use hostinger.com.
- Right-click anywhere on the web page and select Inspect.
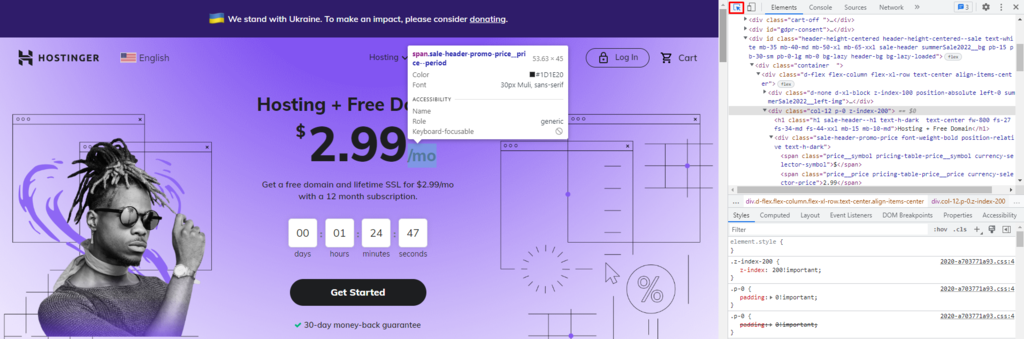
- Activate the Inspect tool and hover your cursor over the element you want to check. Its basic information like color, font, and margin will appear in a box, and the DOM panel will highlight its source code.
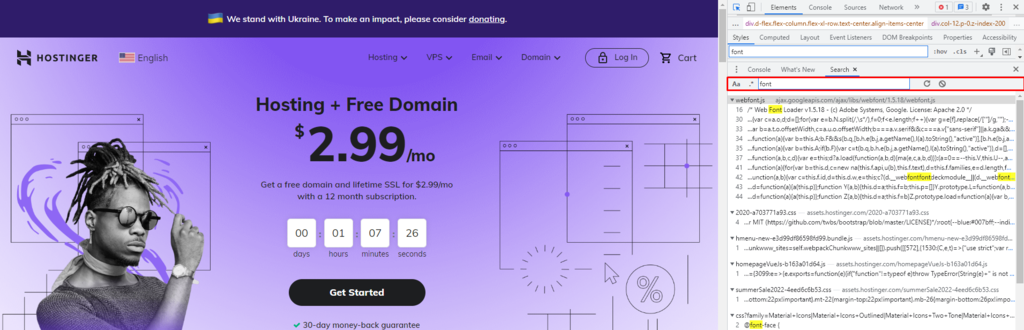
- You can also find a specific CSS style by pressing Ctrl+Shift +F on Windows and Linux or Command+Option+F on macOS.
- A search tab will appear on the lower part of the panel. Enter your query, and the inspector will generate the results.
How to Inspect Element in Other Browsers
Most browsers have a feature similar to the Google Chrome Inspect Element tool. While the features mainly work the same way, various browsers require different steps to run it.
Inspect Element in Safari
Before you can use the Inspect Element tool in Safari, you need to enable the Develop menu:
- Select Safari on the menu bar and choose Preferences from the menu.

- Choose Advanced and tick the box next to Show Develop menu in menu bar to enable Inspect Element.
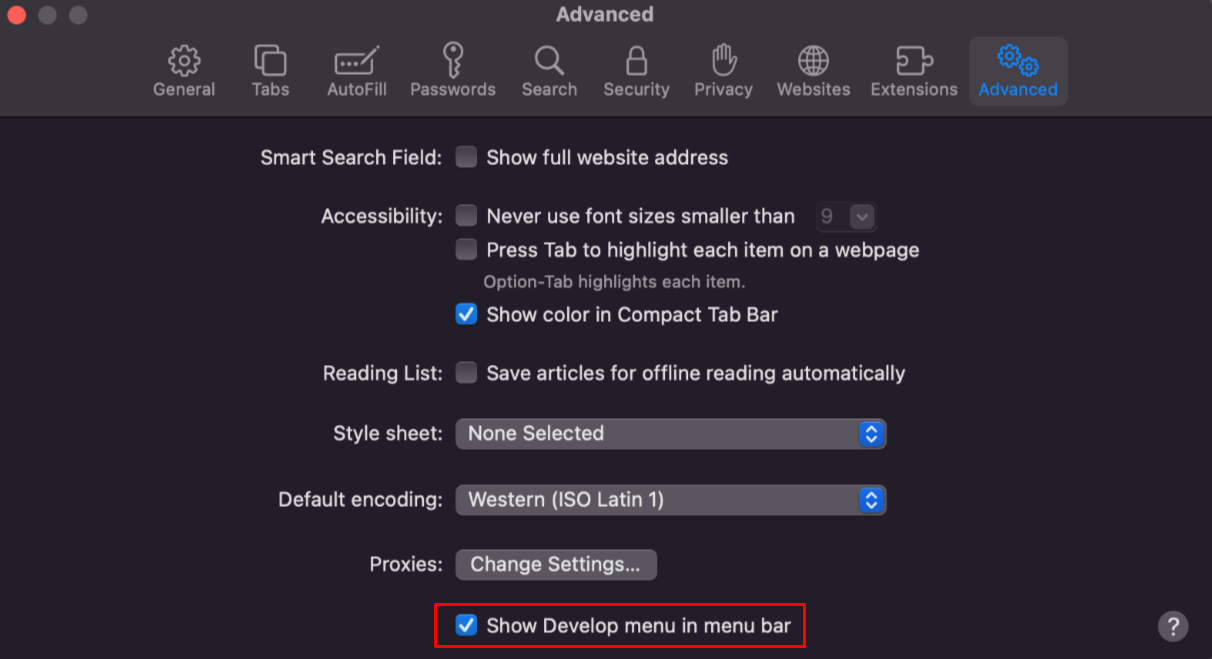
- Once you activate the feature, you’ll see a Develop option added to the menu.

Here’s how to use Inspect Element on Safari:
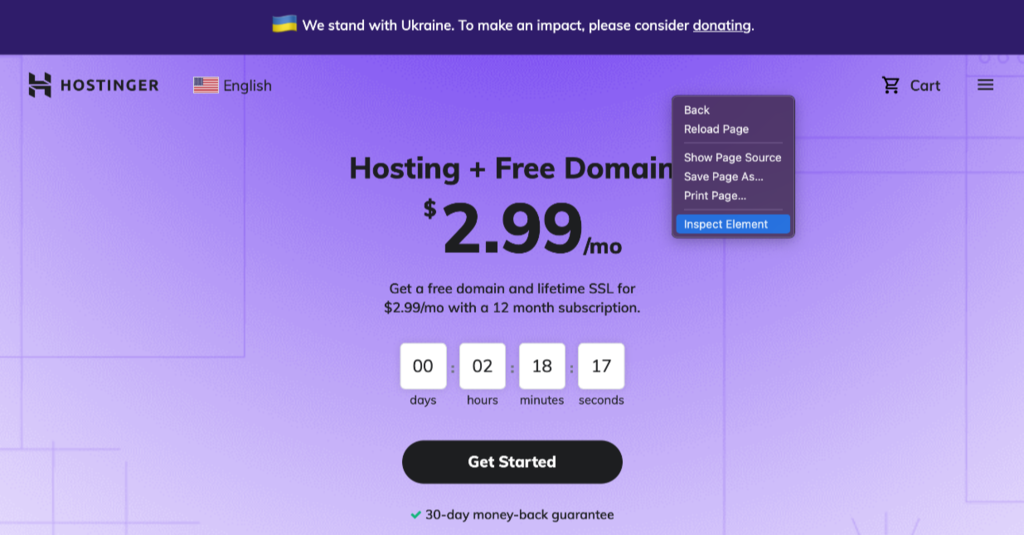
- Open the Safari browser.
- Right-click anywhere on the page and choose Inspect Element, or you can use the keyboard shortcut Command+Option+I.
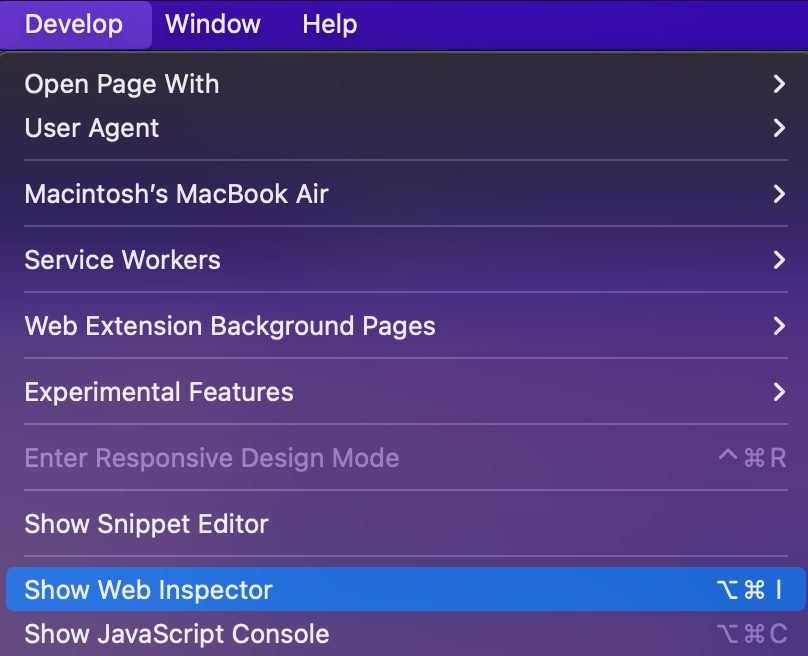
Alternatively, choose Develop -> Show Web Inspector from the menu bar.
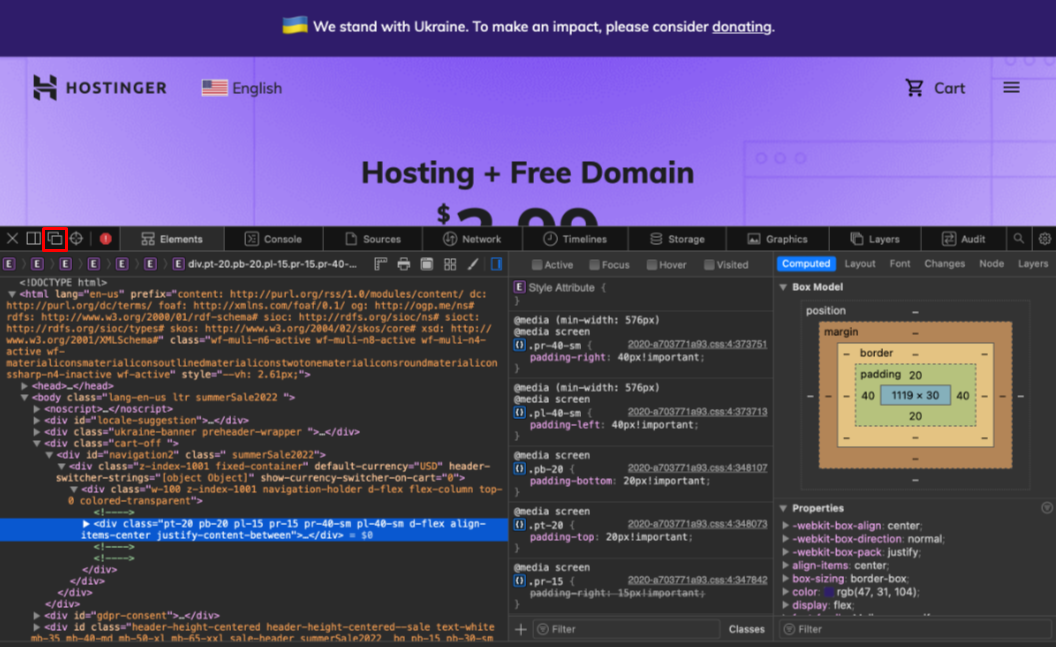
The Inspect Element tool in Safari appears at the bottom of the browser window by default. To change the location, click the icon to dock the panel on the right side or open it in a separate window.
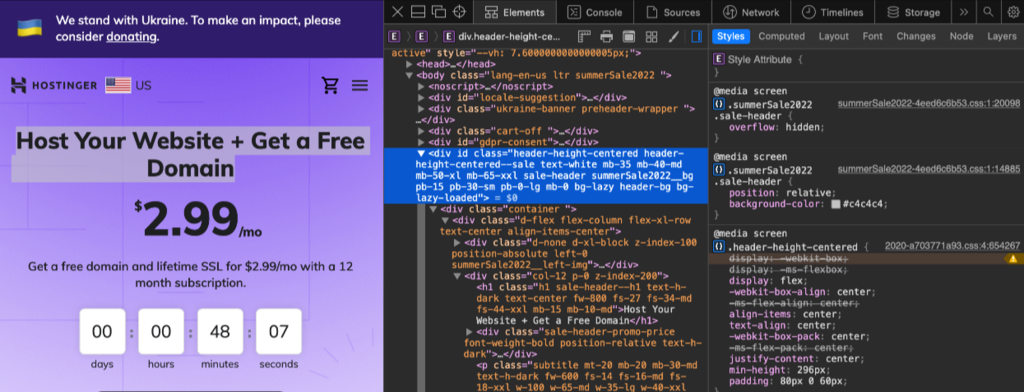
The Web Inspector panel consists of two columns – the first shows the HTML source code, and the second displays the CSS. Use the cursor to navigate the interface and explore the code and lines corresponding to each region.
Alternatively, inspect the page directly by clicking the Inspect tool button on the panel’s upper left corner. As you move the cursor, the tool shows the corresponding source code.
Like the Google Chrome Inspect Element tool, Safari allows users to edit, remove, and add web page elements.
Here’s how to modify a part of a page:
- Open Safari.
- Go to a website. In this example, we use hostinger.com.
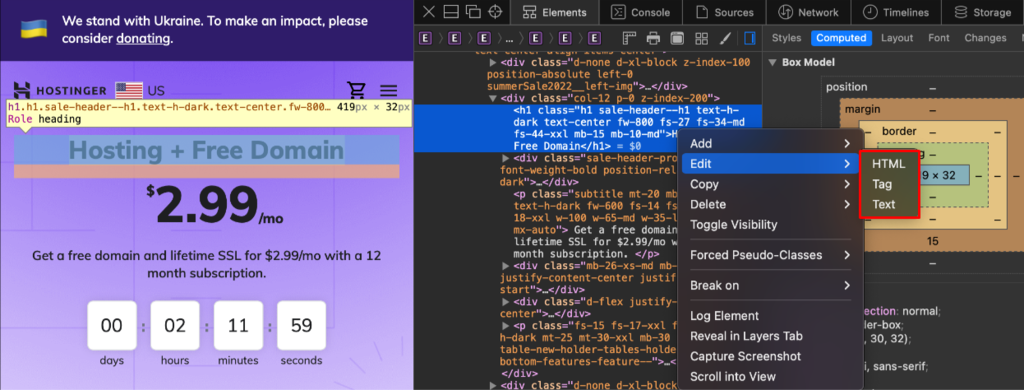
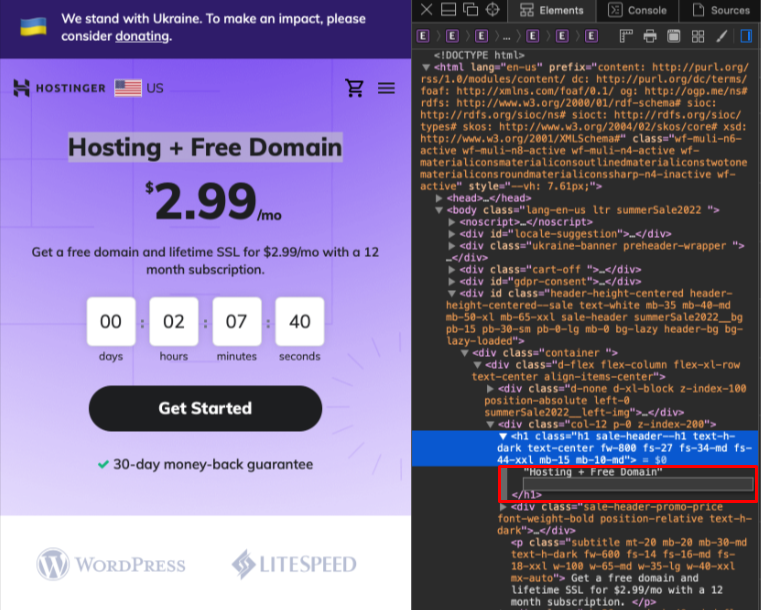
- Right-click an HTML code on the Elements panel and hover over Edit.

- Select an option from the Edit menu.
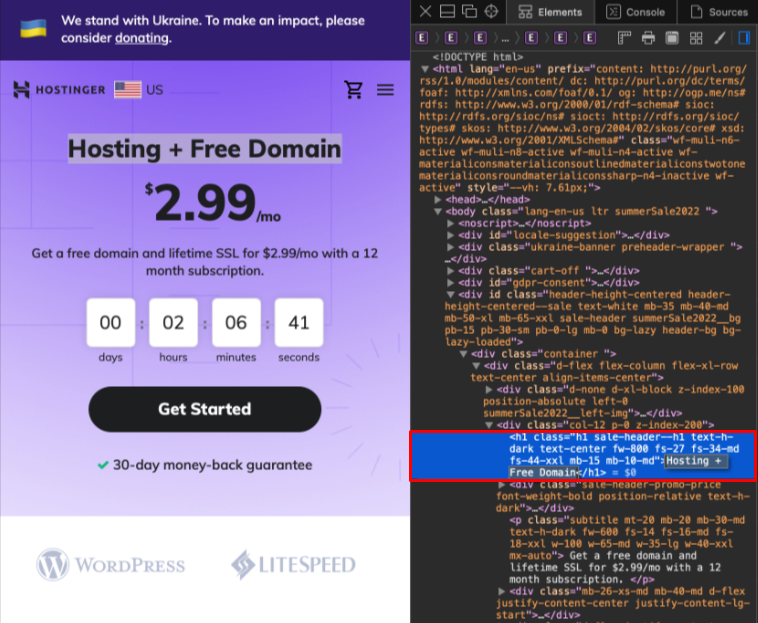
- Web Inspector will prompt you to input the new text and display the changes you’ve made in real-time.
Follow these steps to add a new element to a page:
- Open Safari.
- Access a website. In this case, we’re going to use hostinger.com.
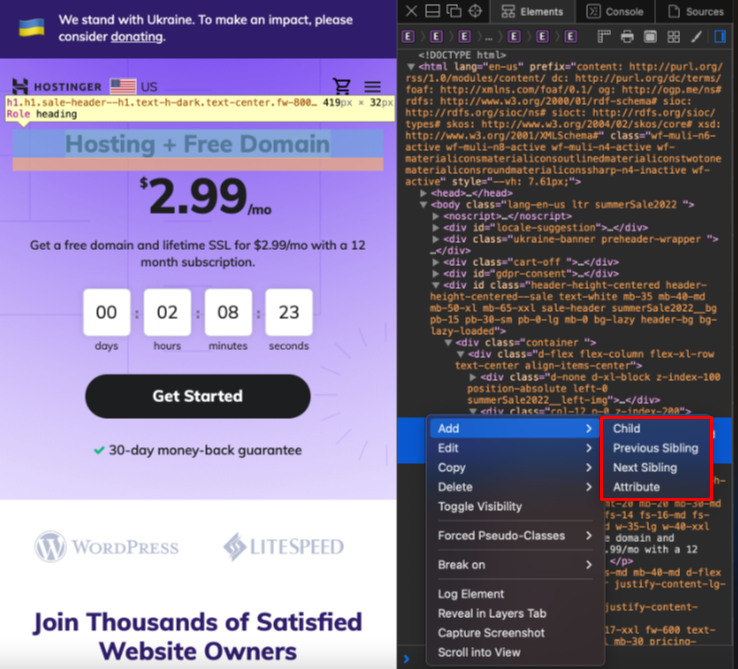
- Right-click a line of code and select an option from the Add menu. In this example, we’re choosing Child.
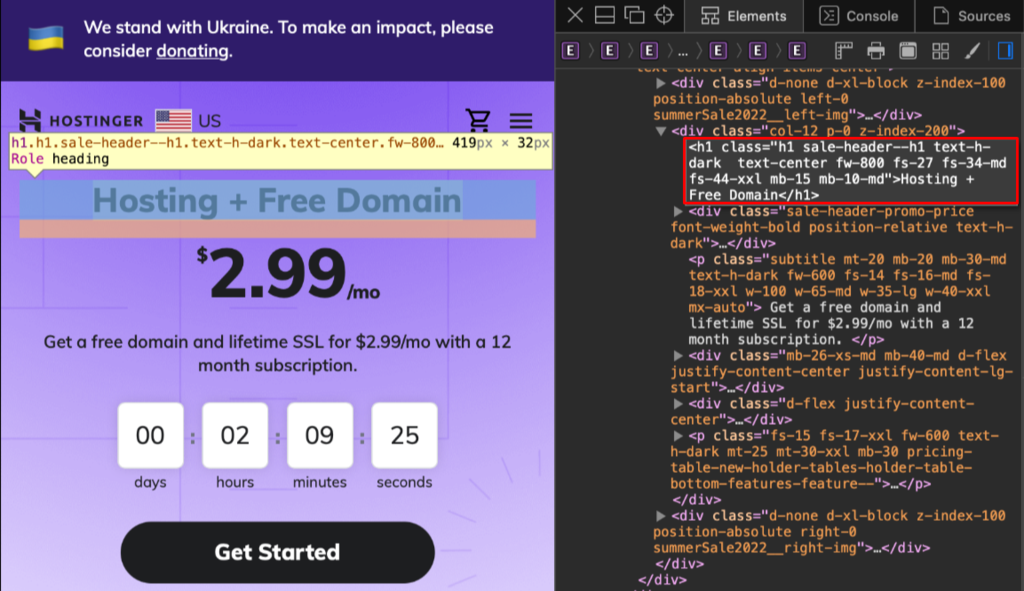
- Specify the element. In this example, we’ll add an <h1>. You can continue writing any code you’d like next to it.
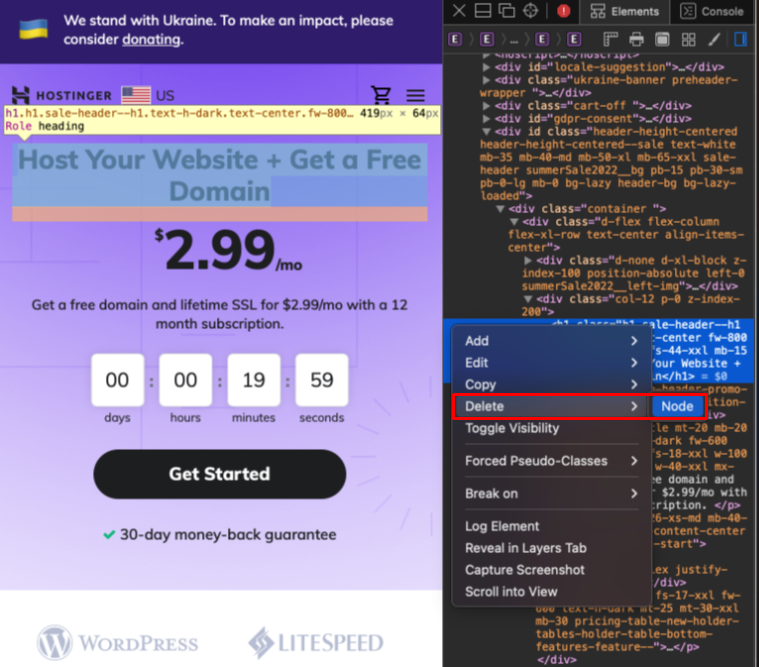
Here’s how to delete a page element:
- Open Safari.
- Go to a website. In this example, we’re accessing hostinger.com.
- Select any code and press Delete.
Alternatively, right-click on a line of code, and select Delete -> Node.
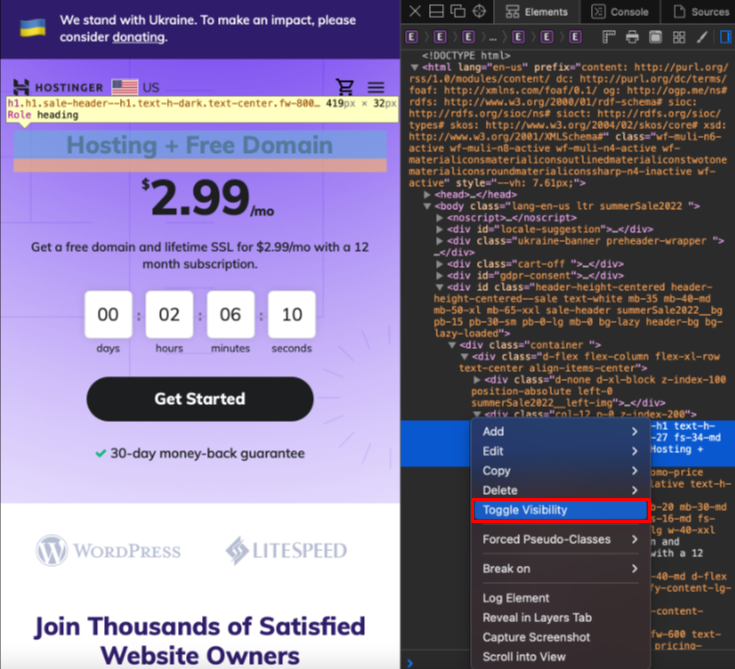
- To hide an element of the desired web page, simply right-click on the code you want to conceal and choose Toggle Visibility.
In addition, Safari has a Responsive Design Mode that allows you to preview a website across various devices, such as desktop and mobile screens. Here’s how to use it:
- Open Safari.
- Access a website. In this example, we’re using hostinger.com.
- Select the Develop option on the menu bar.
- Choose Enter Responsive Design Mode.
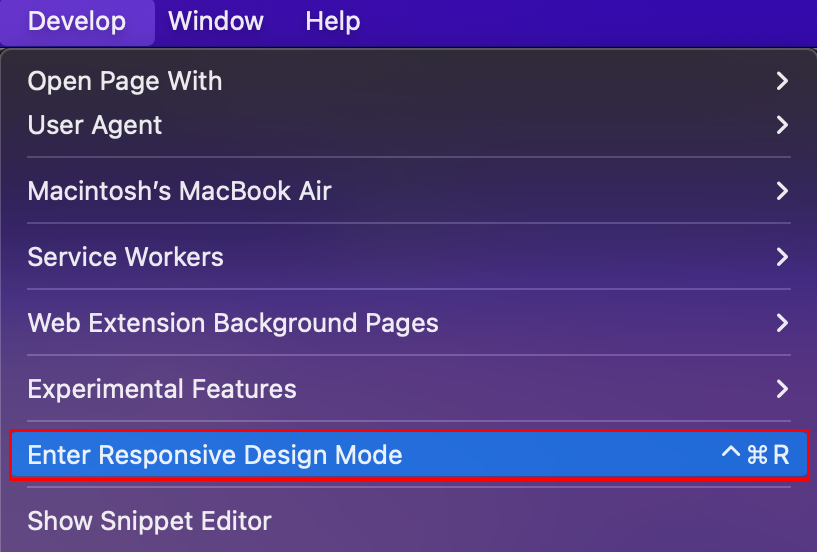
- It will show the available device options and screen resolutions for site preview.

Inspect Element in Mozilla Firefox
The Inspect Element panel is also a built-in feature in the Mozilla Firefox browser. Here’s how to use it:
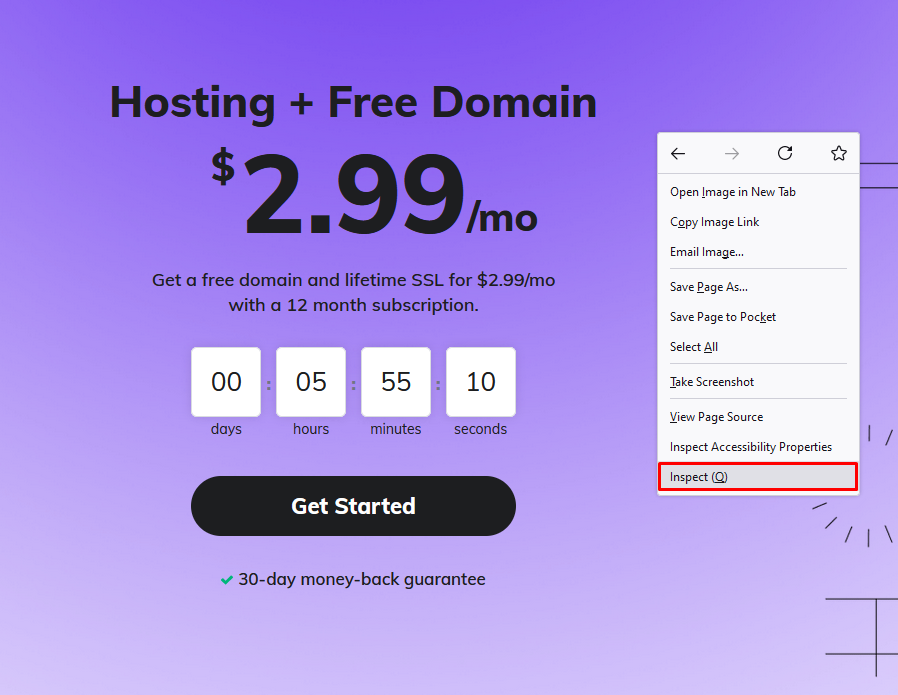
- Open Mozilla Firefox.
- Go to a website. In this example, we’re using hostinger.com.
- Right-click on any part of the page and select Inspect.
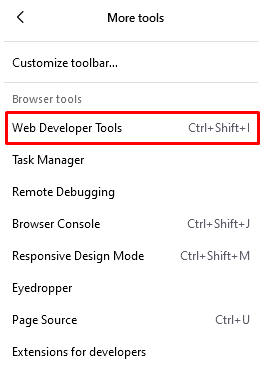
Alternatively, click the three-stripes menu -> More tools.

- Select Web Developer Tools.
You can also use the keyboard shortcut Ctrl+Shift+I to access Inspect Element.
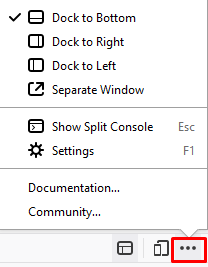
The Firefox inspector appears at the bottom of the window by default. To change its location, click the three-dots menu on the panel’s upper right corner and choose another display option.
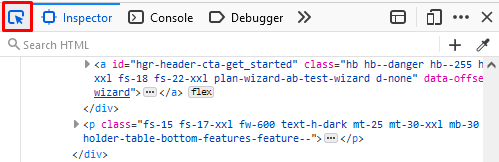
This tool allows you to select a specific element to find its code. Click the Inspect tool on the top-left corner of the panel to enter selection mode.
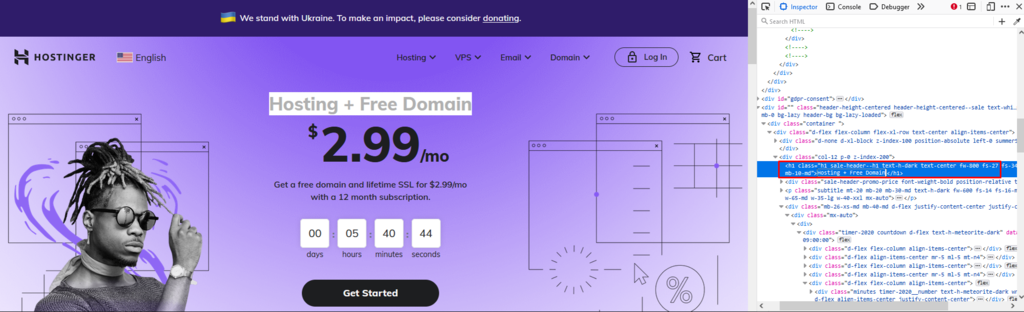
The Inspector panel in Firefox works similarly to Chrome and Safari. The HTML source code is color-coded – blue is content, yellow is margin, and purple is padding.

Here’s how to modify a page element on Firefox:
- Open Mozilla Firefox.
- Access a website. In this example, we’re using hostinger.com.
- Right-click on any specific part of the web page and select Inspect.
- Double-click to change the text.
Alternatively, right-click and choose Edit as HTML to modify the text. The box will expand to allow you to write the code.
- To add a new text, select Create New Code.
- To delete the code, simply double-click and press Backspace or Delete.
Follow these steps to modify the style of an element:
- Open Mozilla Firefox.
- Go to a website. In this example, we’re using hostinger.com.
- Open the Inspector panel and go to Filter Styles at the bottom section.

- Uncheck the box next to a CSS declaration to deactivate a style.
- Click the section, and the tool will provide a new line to add a new code.
Mozilla Firefox also offers Responsive Design Mode to preview several preset screen resolutions. Here’s how to do it:
- Open Mozilla Firefox.
- Access a website. In this example, we’re opening hostinger.com.
- Open the Inspector panel and click the Responsive Design Mode icon at the top-right corner.
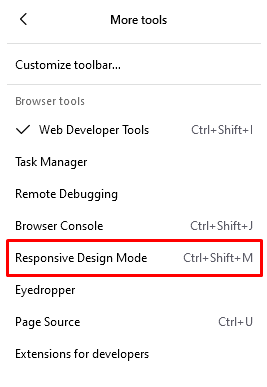
Alternatively, click the three-stripes menu -> More tools -> Responsive Design Mode.
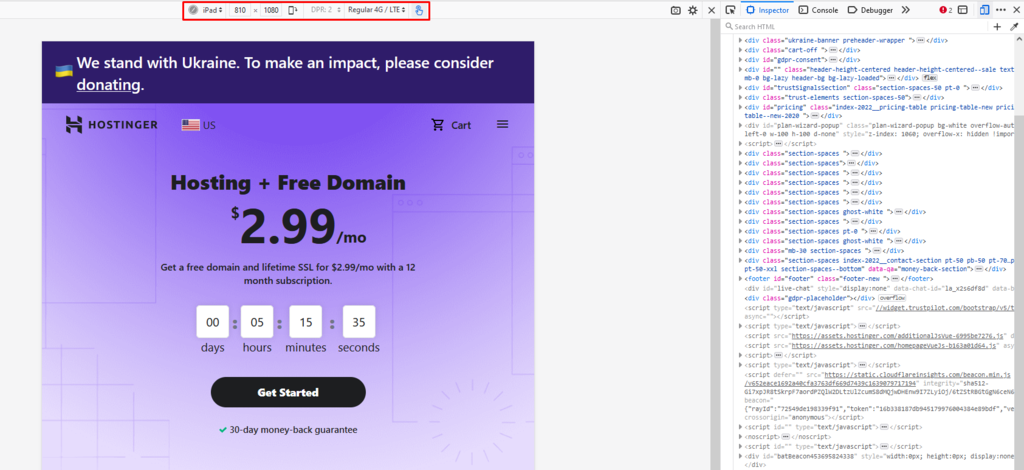
- Activating the mode lets you check the connection speed and device pixel ratio.
Conclusion
The Inspect Element feature lets users modify, edit, or add code to an existing web page. It is helpful for testing site design, debugging, excluding sensitive information from screenshots, researching metadata, and finding hidden keywords.
In this article, we have explained the steps to access Inspect Element and provided its common uses in three web browsers – Google Chrome, Safari, and Mozilla Firefox.
We hope this article has helped you learn how to use Inspect Element and some of its implementations. If you have any questions or suggestions, let us know in the comments section below.
Learn More About Website Maintenance
Hotlinking: What Is It and Why Is It Bad?
How to Use Cookie-Free Domains
How to Check Your Website’s PHP Error Log
How to Test Website Speed
All of the tutorial content on this website is subject to Hostinger's rigorous editorial standards and values.

Linas started as a customer success agent and is now a full-stack web developer and Technical Team Lead at Hostinger. He is passionate about presenting people with top-notch technical solutions, but as much as he enjoys coding, he secretly dreams of becoming a rock star.

Noviantika is a web development enthusiast with customer obsession at heart. Linux commands and web hosting are like music to her ears. When she's not writing, Noviantika likes to snuggle with her cats and brew some coffee.