How to set up the LGTM stack for end-to-end observability
Aug 26, 2025
/
Ariffud M. & Valentinas C.
/
11 min Read
The LGTM stack – consisting of Loki for logs, Grafana for visualization, Tempo for tracing, and Mimir for metrics – is an open-source observability suite developed by Grafana Labs.
This powerful stack unifies metrics, logs, and traces into a single platform, giving teams a complete view of system performance.
In this guide, you’ll set up the LGTM stack on a virtual private server (VPS). You’ll configure each component and create a comprehensive observability dashboard to gain clear, end-to-end visibility into your apps and infrastructure.
What is end-to-end observability?
End-to-end observability means monitoring and analyzing an app’s entire lifecycle, from user interactions on the front end to services and infrastructure components on the back end.
Unlike traditional monitoring, which tracks only predefined metrics to measure system health and alert on known issues, end-to-end observability provides a unified view of:
- User interactions – tracking frontend metrics and user behavior.
- App performance – monitoring back-end services and internal APIs.
- Infrastructure health – assessing the status of servers, databases, and networks.
- Third-party services – observing dependencies like payment gateways or cloud providers.
By correlating data across all layers, teams gain insights into how changes in one area impact overall system performance, and can quickly spot issues wherever they occur.
The LGTM stack supports end-to-end observability by instrumenting apps to collect telemetry data: logs, metrics, and traces. The stack aggregates this data through its components and visualizes it in Grafana dashboards for easy analysis.
This approach delivers several benefits:
- Comprehensive monitoring – the LGTM stack provides a holistic view of system behavior, enabling proactive issue detection and resolution.
- Improved troubleshooting – correlating data from multiple sources helps teams quickly identify root causes, reducing the mean time to resolution (MTTR).
- Scalability – each LGTM component scales horizontally to support complex, distributed systems.
- Cost-effectiveness – as an open-source solution, the LGTM stack eliminates licensing fees associated with proprietary observability tools.
Prerequisites
Before setting up the LGTM stack, prepare a VPS instance to host it. Grafana, the main interface for visualizing observability data, doesn’t require heavy resources. You can run the full LGTM stack on a VPS with as little as:
- 1 CPU core.
- 512 MB of RAM.
But since the LGTM stack monitors system performance and app behavior, choose a VPS plan that matches your system’s scale and usage.
The VPS service from Hostinger is a great choice, offering plans from $6.49 to $25.99/month.
Our plans scale up to 8 vCPU cores, 32 GB of RAM, and 400 GB of NVMe storage. You can upgrade anytime if your observability stack needs more power or space.

Next, configure your firewall. Open the following ports on your VPS to ensure the LGTM components run smoothly:
| Port | Component | Purpose |
| 3000/TCP | Grafana | Web interface for dashboards and data source management |
| 3100/TCP | Loki | Receives log data and serves log queries |
| 3200/TCP | Tempo | Handles trace data collection and querying |
| 9090/TCP | Mimir (builds on Prometheus) | Exposes Prometheus-compatible APIs for metric storage and querying |
| 4318/TCP | OpenTelemetry Collector (additional tool) | Accepts telemetry data in OTLP/HTTP format |
If you just purchased a VPS or haven’t configured a firewall yet, you can skip this step.
For users with Uncomplicated Firewall (UFW) enabled, open your terminal and run these commands:
sudo ufw allow 3000/tcp    # Grafana
sudo ufw allow 3100/tcp    # Loki
sudo ufw allow 3200/tcp    # Tempo
sudo ufw allow 9090/tcp    # Mimir
sudo ufw allow 4318/tcp    # OpenTelemetry Collector
Then, verify that UFW is active and the rules are applied by running:
sudo ufw status
How to set up the LGTM stack on a VPS
You can set up the LGTM stack on your VPS in several ways. This tutorial uses Docker Compose, which lets you quickly deploy and manage all components in a single file. It’s the easiest method and works well for beginners.
If you prefer more control or want to avoid Docker, we’ll also provide instructions for installing each component manually.
1. Prepare the environment
Start by updating your VPS’s package lists and upgrading installed packages to the latest versions. This ensures your server has the newest security patches and software improvements:
sudo apt update && sudo apt upgrade -y
Optionally, remove unused packages and dependencies to free up disk space:
sudo apt autoremove -y
Next, install Docker on your server to enable containerized deployment and use Docker Compose.
Hostinger VPS customers can simplify setup by using a one-click preconfigured Docker template. Otherwise, install the platform manually using Linux commands.
If you don’t plan to use Docker, feel free to skip this part.
After installation, verify that Docker is running by executing:
sudo systemctl status docker
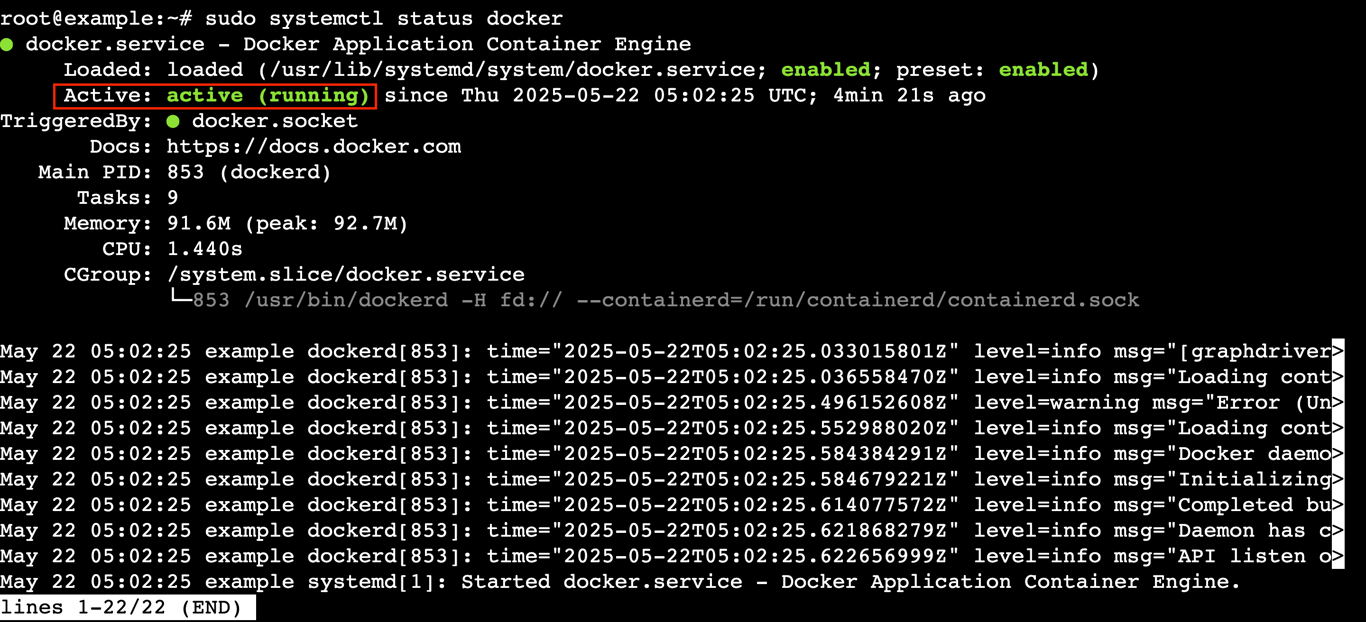
Press Ctrl + C to exit the status view.
Once done, create a new directory for your LGTM stack files and navigate into it. Replace grafana-lgtm with your preferred directory name:
mkdir grafana-lgtm

cd grafana-lgtm
2. Set up Loki for log aggregation
Loki handles log aggregation by collecting and storing logs from various sources.
It indexes only metadata instead of full log content, reducing storage costs and boosting query performance, especially when dealing with large volumes of log data.
Inside your grafana-lgtm directory, create a new file named loki-local-config.yaml using the nano text editor:
sudo nano loki-local-config.yaml
Paste the following configuration into the file:
auth_enabled: false

server:
  http_listen_port: 3100

schema_config:
  configs:
    - from: 2020-10-24
      store: boltdb-shipper
      object_store: filesystem
      schema: v11
      index:
        prefix: index_
        period: 24h

storage_config:
  boltdb_shipper:
    active_index_directory: /tmp/loki/boltdb-shipper-active
    cache_location: /tmp/loki/boltdb-shipper-cache
    cache_ttl: 24h
  filesystem:
    directory: /tmp/loki/chunks

limits_config:
  reject_old_samples: true
  reject_old_samples_max_age: 168h
  allow_structured_metadata: false

ingester:
  lifecycler:
    address: 127.0.0.1
    ring:
      kvstore:
        store: inmemory
      replication_factor: 1
    final_sleep: 0s
  chunk_idle_period: 5m
  chunk_retain_period: 30s

common:
  path_prefix: /tmp/loki

compactor:
  working_directory: /tmp/loki/compactor
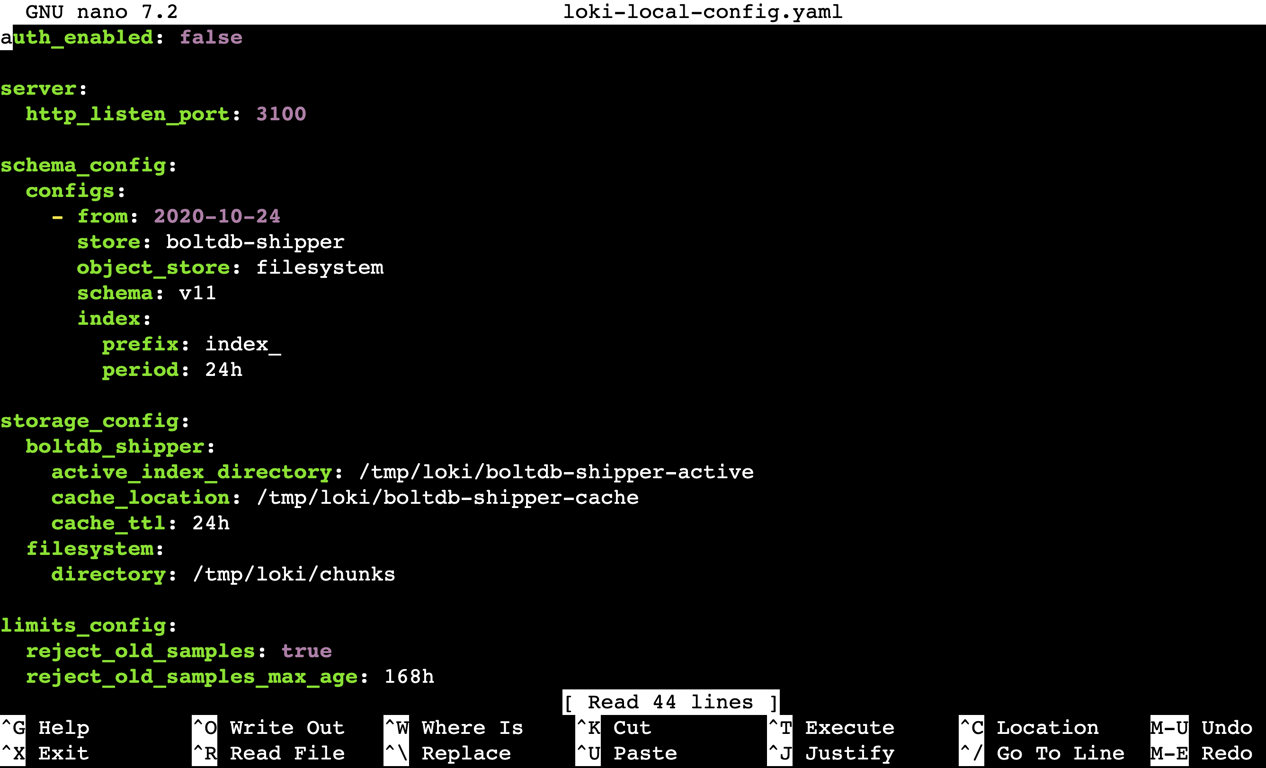
When you finish, press Ctrl + X → Y → Enter to save the file and exit nano.
If you prefer, you can learn how to install Loki manually by following our detailed guide.
3. Configure Mimir for metric storage
Grafana Mimir builds on Prometheus and extends it by offering scalable, long-term storage and high-performance querying for large volumes of time-series data.
But in this guide, we use Prometheus alone because it integrates better with OpenTelemetry Collector to gather metrics for this setup.
If you also want to use Mimir for advanced scaling and storage, check out our Mimir installation article to learn how to set it up alongside Prometheus.
Create a new prometheus.yml file using nano, just like you did for Loki’s config. Then, paste the configuration below:
global:
  scrape_interval: 5s            # Scraping interval, shortened to 5 seconds to get data faster (default is 1m)
scrape_configs:
  - job_name: 'otel-collector'
    static_configs:
      - targets: ['otel-collector:9464']   # Target is the Prometheus Exporter port of OTel Collector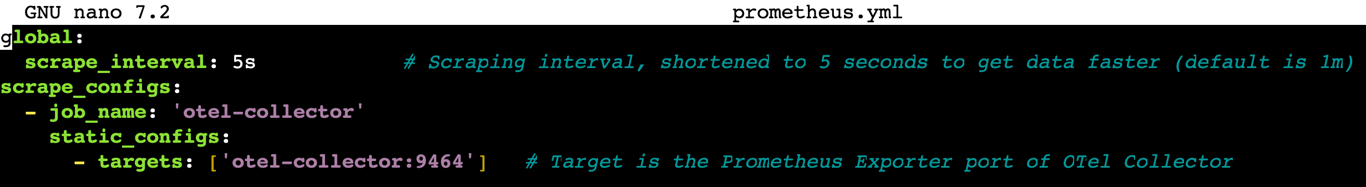
Save the file when you’re done.
4. Integrate Tempo for distributed tracing
Grafana Tempo is a high-scale, distributed tracing back end that collects, stores, and queries trace data across microservice architectures.
Using Tempo, you can visualize the path of requests as they travel through various services. This helps identify bottlenecks quickly and effectively.
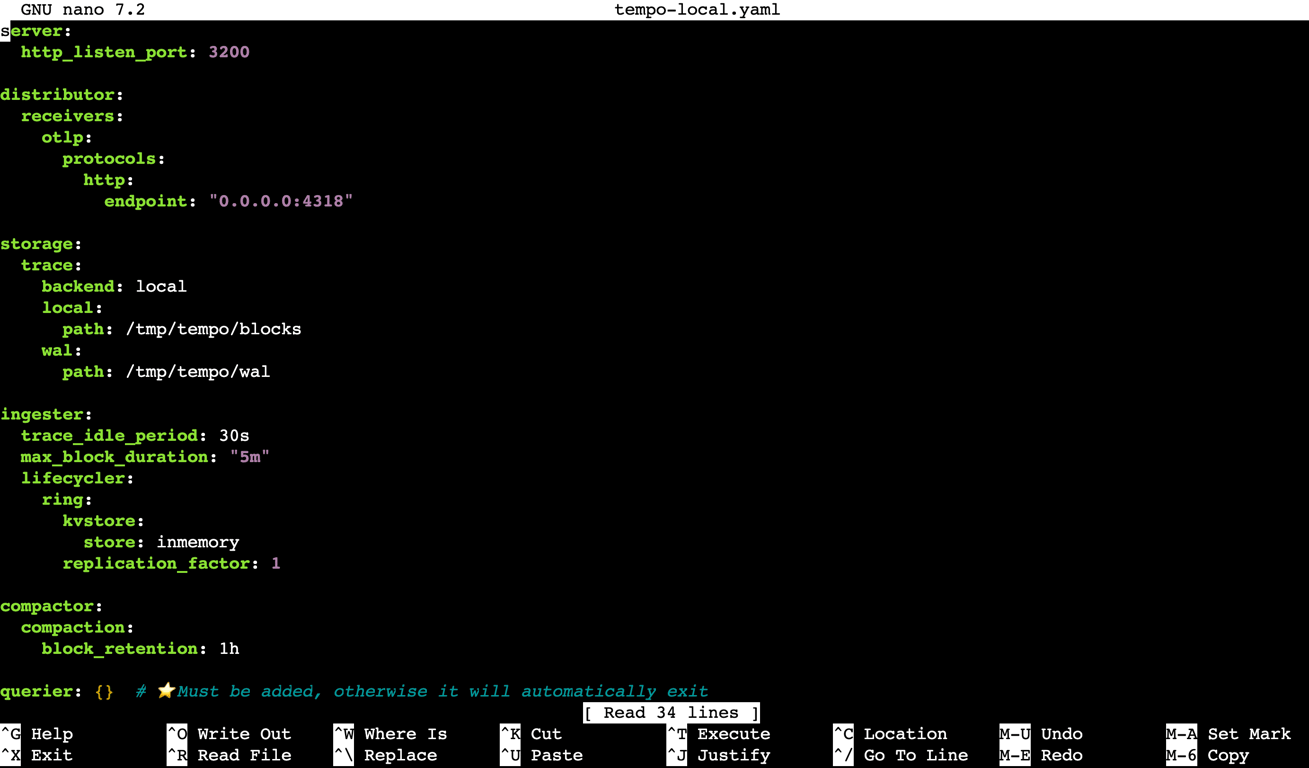
Like the previous components, create a file named tempo-local.yaml to store Tempo’s configuration:
distributor:
  receivers:
    otlp:
      protocols:
        http:
          endpoint: "0.0.0.0:4318"

storage:
  trace:
    backend: local
    local:
      path: /tmp/tempo/blocks
    wal:
      path: /tmp/tempo/wal

ingester:
  trace_idle_period: 30s
  max_block_duration: "5m"
  lifecycler:
    ring:
      kvstore:
        store: inmemory
      replication_factor: 1

compactor:
  compaction:
    block_retention: 1h

querier: {}  # ⭐ Must be added, otherwise it will automatically exit

multitenancy_enabled: false  # ⭐ Recommended to add, to avoid single-tenant environment errors
We also provide a tutorial on setting up Tempo manually for those who prefer a hands-on approach.
5. Install Grafana for observability
Grafana serves as the central visualization layer in the LGTM stack, integrating data from all other components into one place. This simplifies spotting and resolving system anomalies.
You can install Grafana on your VPS either manually or as part of the services in a Docker Compose file.
If you choose the latter, start by creating a new folder named grafana inside the grafana-lgtm directory:
mkdir grafana

cd grafana
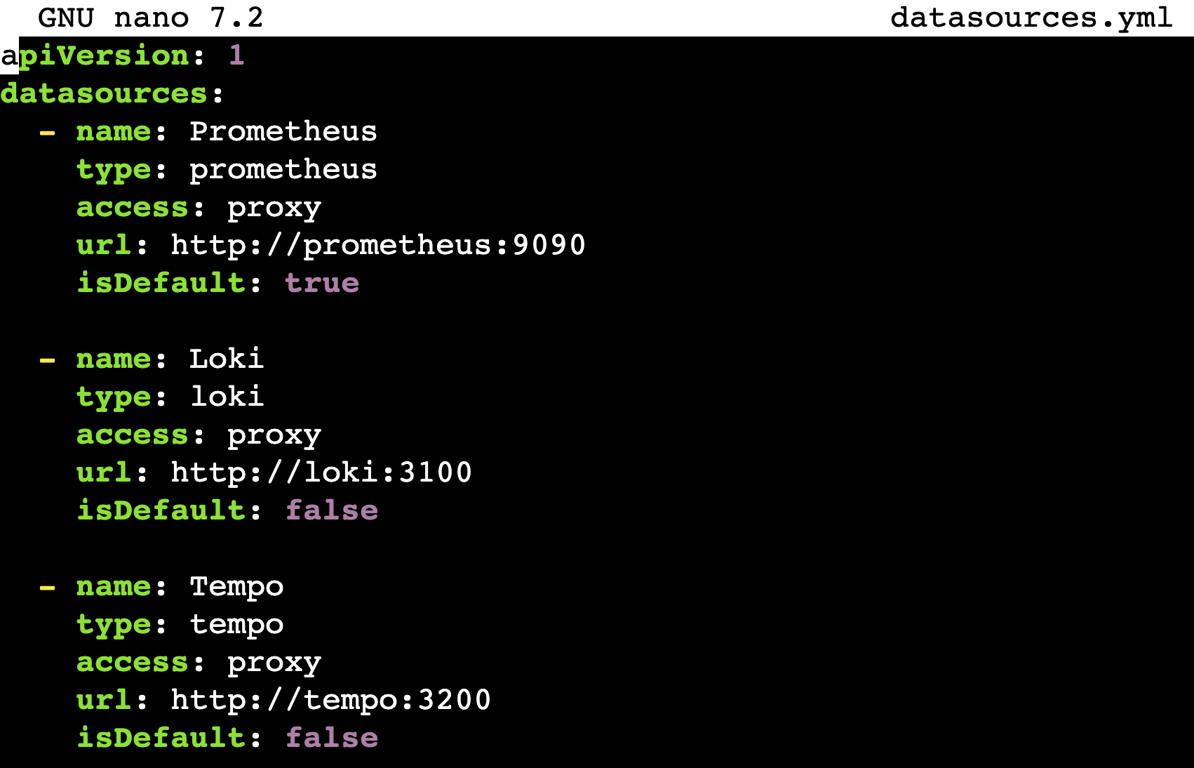
Next, create a file named datasources.yml inside grafana-lgtm/grafana to configure data sources. Paste the following content:
apiVersion: 1
datasources:
  - name: Prometheus
    type: prometheus
    access: proxy
    url: http://prometheus:9090
    isDefault: true

  - name: Loki
    type: loki
    access: proxy
    url: http://loki:3100
    isDefault: false

  - name: Tempo
    type: tempo
    access: proxy
    url: http://tempo:3200
    isDefault: false
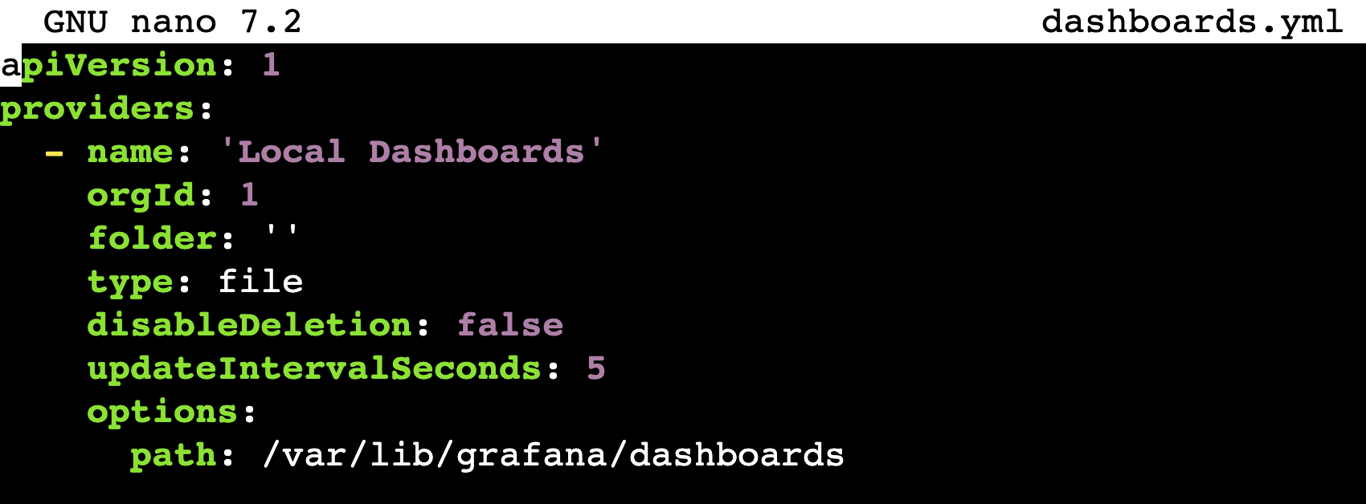
Then, create another file called dashboards.yml in the same folder to set up dashboard providers:
apiVersion: 1
providers:
  - name: 'Local Dashboards'
    orgId: 1
    folder: ''
    type: file
    disableDeletion: false
    updateIntervalSeconds: 5
    options:
      path: /var/lib/grafana/dashboards
After that, create a dashboards folder and navigate into it:
mkdir dashboards

cd dashboards
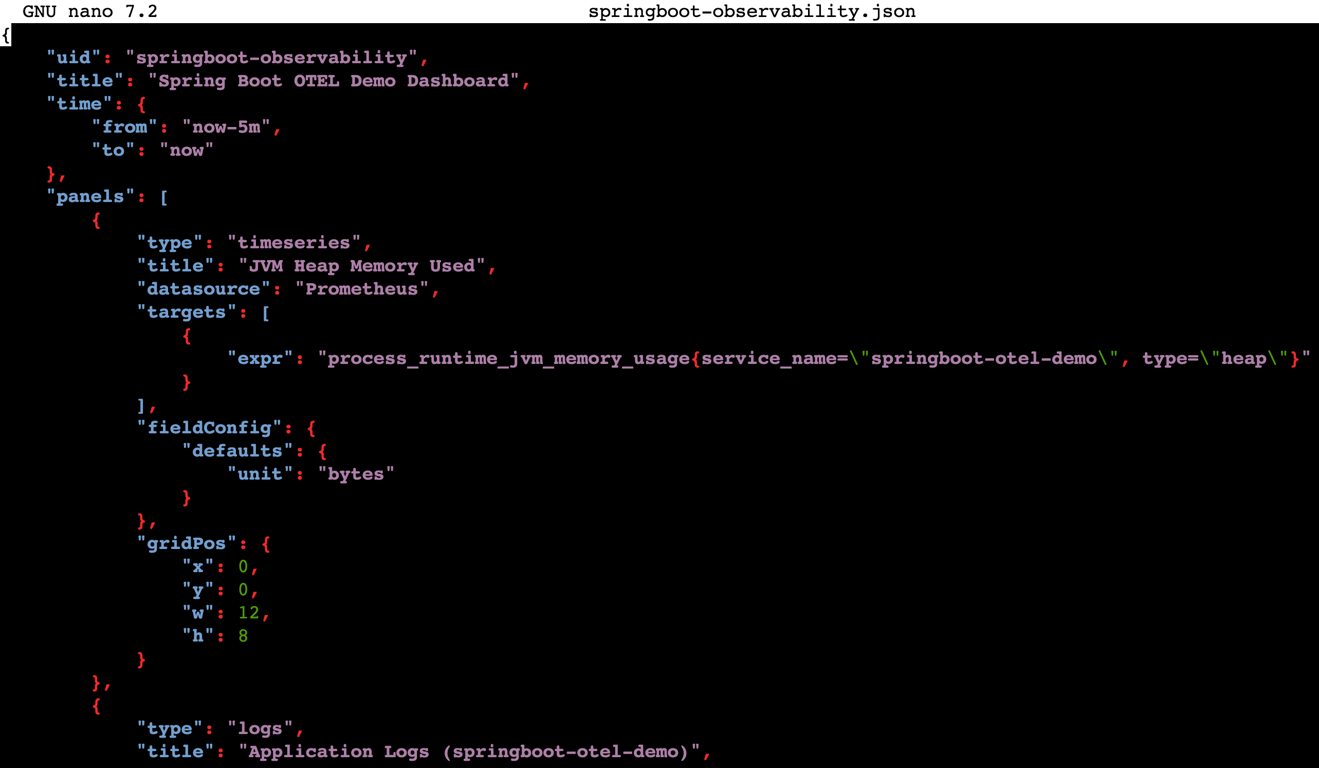
Add a file named springboot-observability.json. This file serves as a sample dashboard:
{
    "uid": "springboot-observability",
    "title": "Spring Boot OTEL Demo Dashboard",
    "time": {
        "from": "now-5m",
        "to": "now"
    },
    "panels": [
        {
            "type": "timeseries",
            "title": "JVM Heap Memory Used",
            "datasource": "Prometheus",
            "targets": [
                {
                    "expr": "process_runtime_jvm_memory_usage{service_name=\"springboot-otel-demo\", type=\"heap\"}"
                }
            ],
            "fieldConfig": {
                "defaults": {
                    "unit": "bytes"
                }
            },
            "gridPos": {
                "x": 0,
                "y": 0,
                "w": 12,
                "h": 8
            }
        },
        {
            "type": "logs",
            "title": "Application Logs (springboot-otel-demo)",
            "datasource": "Loki",
            "targets": [
                {
                    "expr": "{service_name=\"springboot-otel-demo\"}"
                }
            ],
            "gridPos": {
                "x": 0,
                "y": 8,
                "w": 24,
                "h": 8
            }
        }
    ]
}
6. Create a Docker Compose file
After configuring each component, create a Docker Compose file. This file defines and manages all LGTM stack services in one place, making deployment simple and consistent.
You can skip this step if you installed all components manually without Docker.
First, return to the grafana-lgtm directory, then create a docker-compose.yml file:
cd ~/grafana-lgtm
sudo nano docker-compose.yml
Add the configuration below to the file:
services:
prometheus:
image: prom/prometheus:latest
container_name: prometheus
volumes:
- ./prometheus.yml:/etc/prometheus/prometheus.yml:ro
ports:
- "9090:9090"
loki:
image: grafana/loki:latest
container_name: loki
user: "0:0" # Run as root user
volumes:
- ./loki-local-config.yaml:/etc/loki/local-config.yaml:ro
- loki-data:/tmp/loki
command: -config.file=/etc/loki/local-config.yaml
ports:
- "3100:3100"
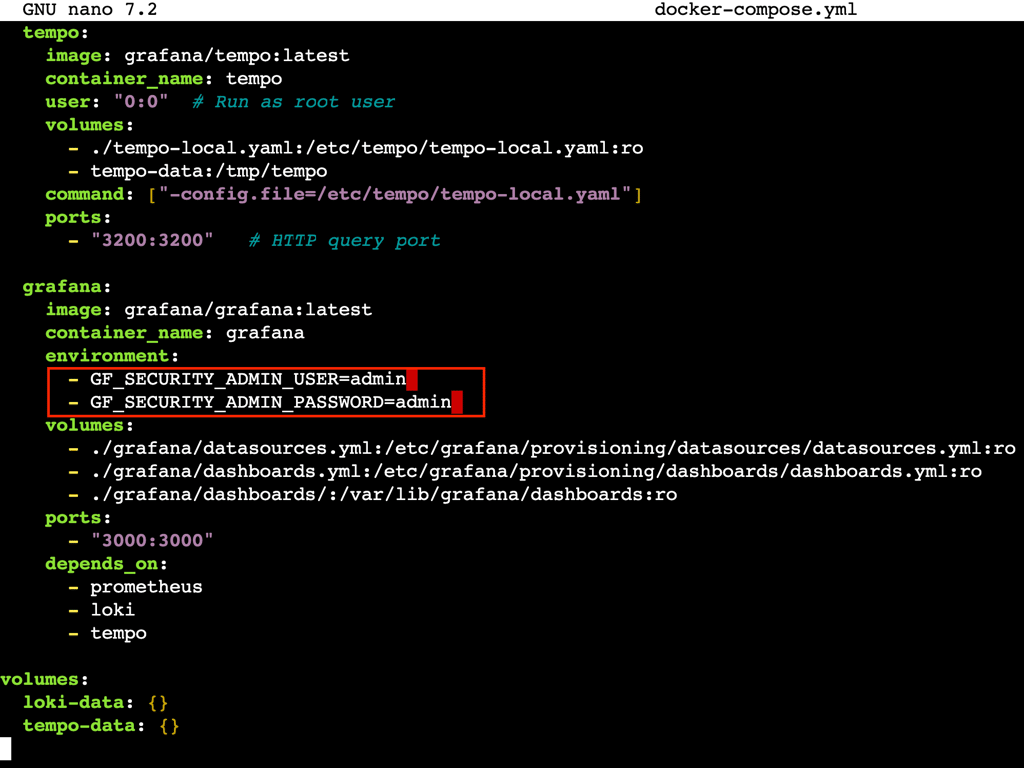
tempo:
image: grafana/tempo:latest
container_name: tempo
user: "0:0" # Run as root user
volumes:
- ./tempo-local.yaml:/etc/tempo/tempo-local.yaml:ro
- tempo-data:/tmp/tempo
command: ["-config.file=/etc/tempo/tempo-local.yaml"]
ports:
- "3200:3200" # HTTP query port
grafana:
image: grafana/grafana:latest
container_name: grafana
environment:
- GF_SECURITY_ADMIN_USER=admin
- GF_SECURITY_ADMIN_PASSWORD=admin
volumes:
- ./grafana/datasources.yml:/etc/grafana/provisioning/datasources/datasources.yml:ro
- ./grafana/dashboards.yml:/etc/grafana/provisioning/dashboards/dashboards.yml:ro
- ./grafana/dashboards/:/var/lib/grafana/dashboards:ro
ports:
- "3000:3000"
depends_on:
- prometheus
- loki
- tempo
volumes:
loki-data: {}
tempo-data: {}
Pay attention to the GF_SECURITY_ADMIN_USER and GF_SECURITY_ADMIN_PASSWORD values under the grafana service. These are your default login credentials for the Grafana dashboard. Change them to improve security.
Don’t forget to save the file after editing.
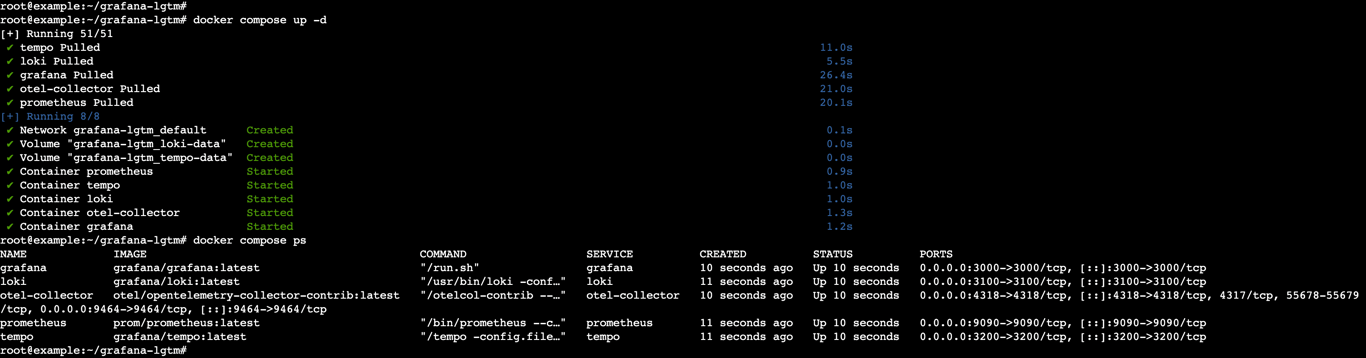
Next, deploy all services on your server with:
docker compose up -d
To verify the services are running, execute:
docker compose ps
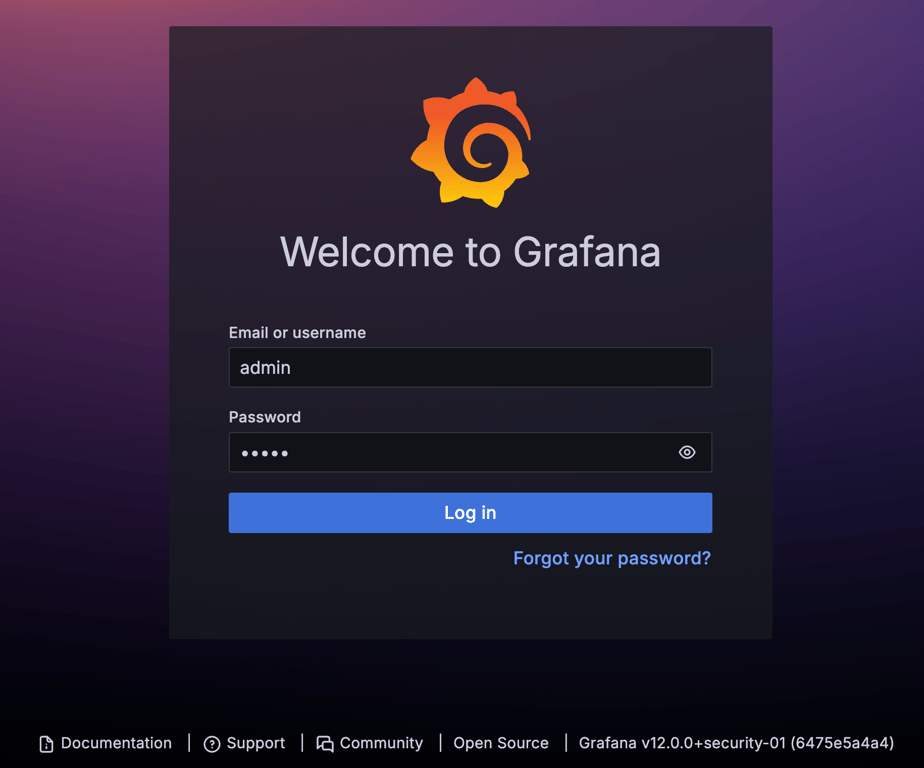
7. Access the Grafana dashboard
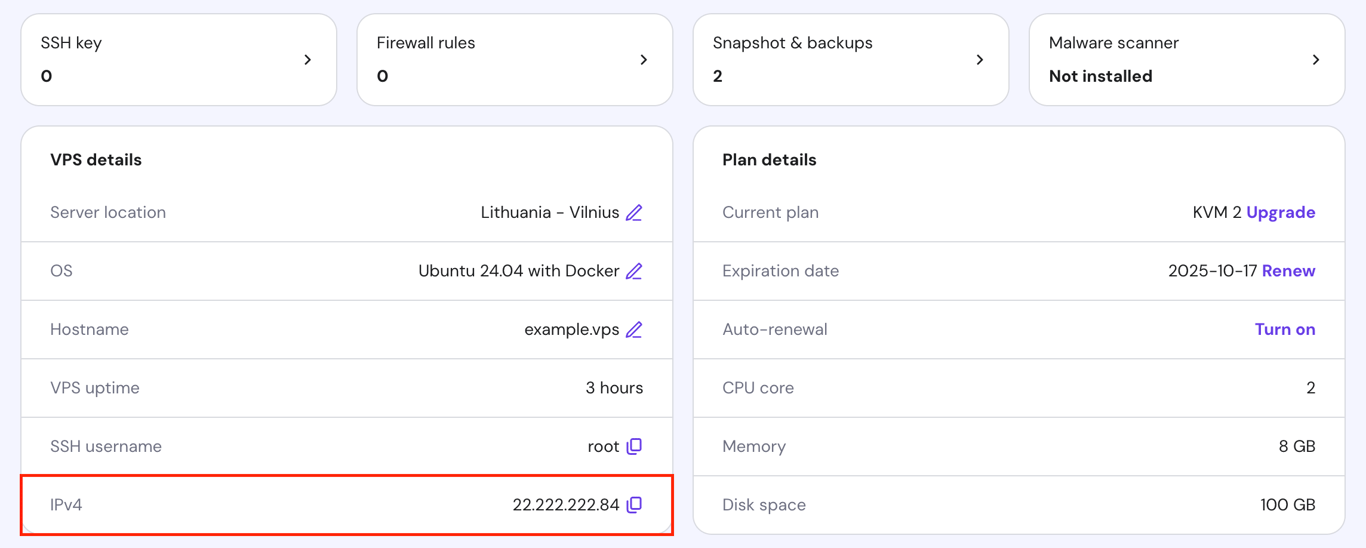
Open your browser and go to the Grafana dashboard using this URL. Replace your_vps_ip with your server’s actual IP address:
http://your_vps_ip:3000
If you host your LGTM stack on Hostinger’s VPS, find your IP address in hPanel under VPS → Manage → Overview → VPS details.
Log in using the username and password you set in the Compose file. If you use the default credentials, Grafana will prompt you to change your password on the next screen.
The dashboard interface has a left sidebar with navigation menus and a main workspace on the right where you view and manage dashboards.
If you set up the components via Docker Compose, Grafana automatically adds all data sources. To verify, go to Connections → Data sources.
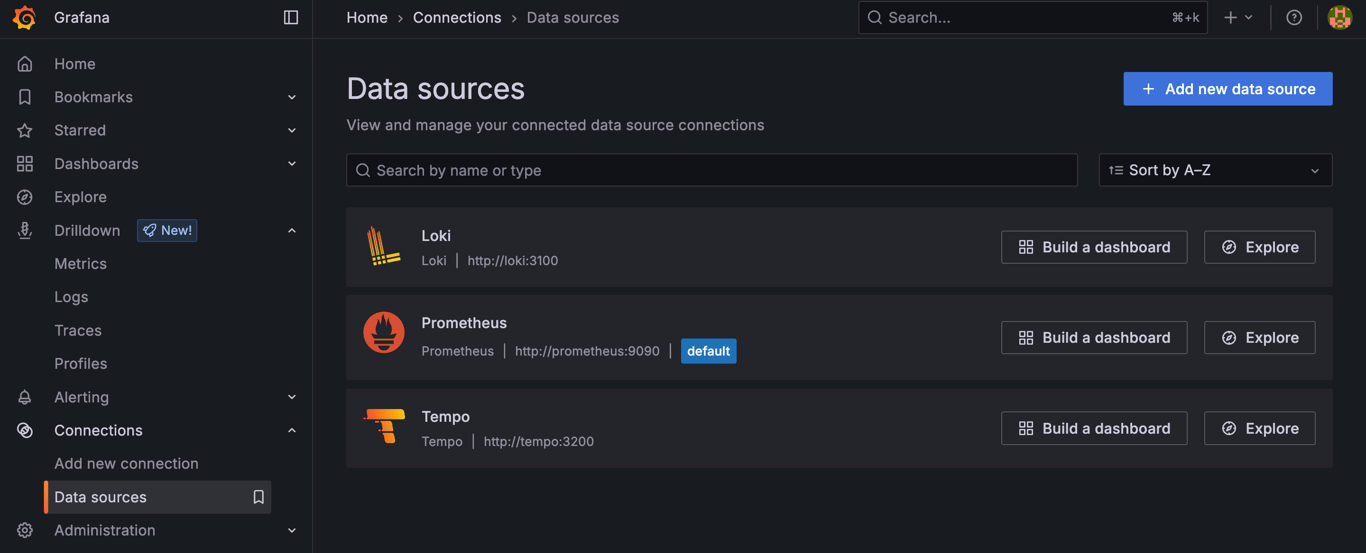
If you installed components manually, you must add data sources yourself. Hit Add new data source, search for the component name, and select it.
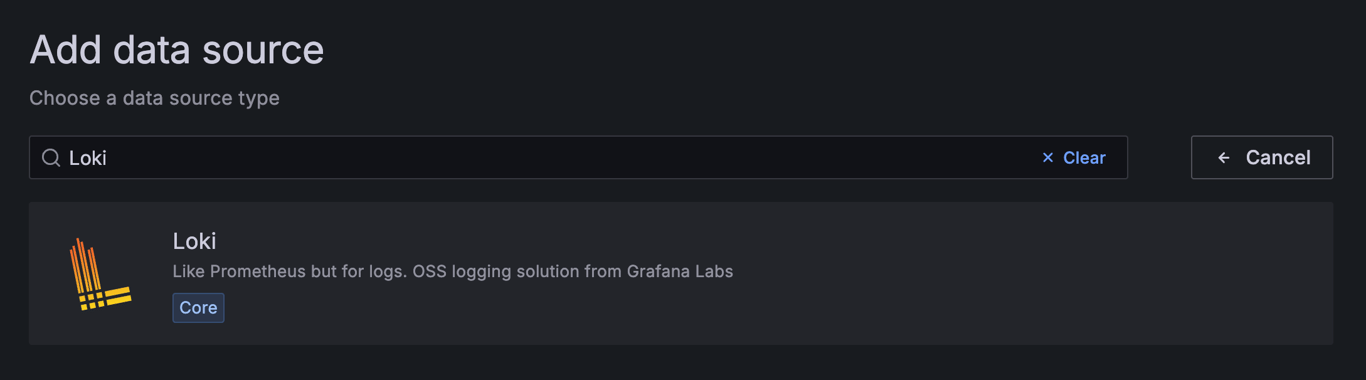
Then, fill in the URL field for each component as follows:
- Loki – http://loki:3100
- Mimir and Prometheus – http://prometheus:9090
- Tempo – http://tempo:3200
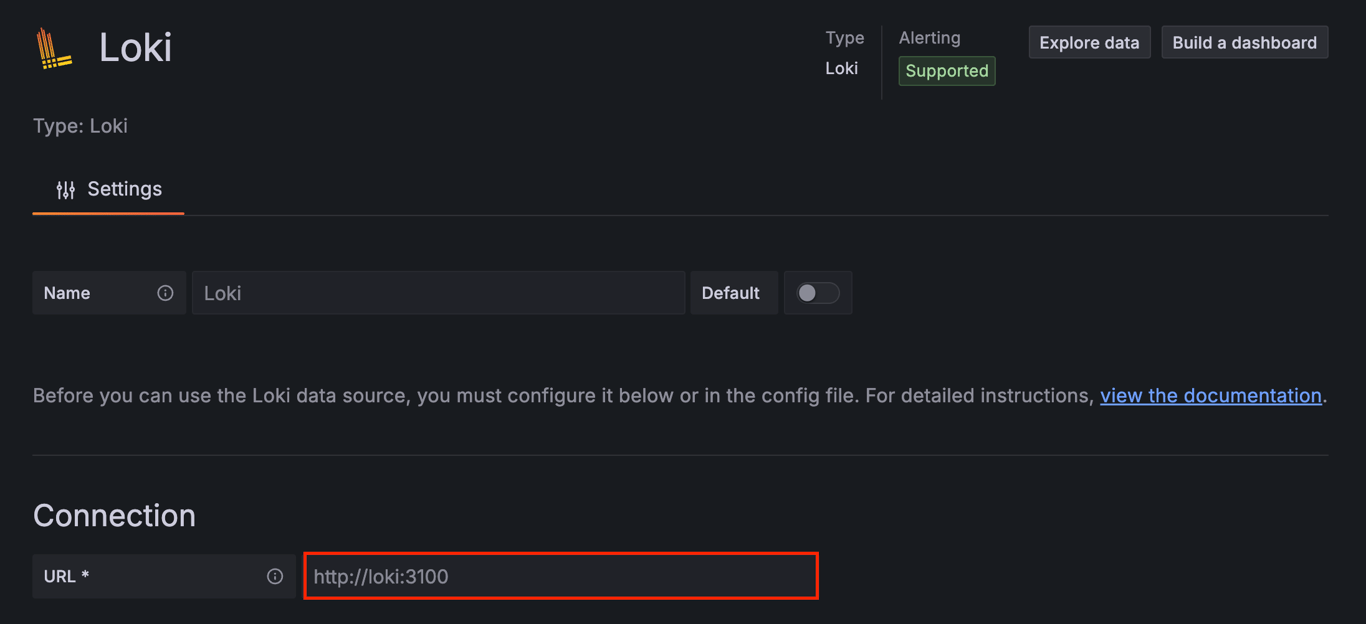
After entering each data source, scroll down and click Save & test.
8. Explore data sources
Next, let’s view your data by running queries. Each component uses its query language: LogQL for Loki, PromQL for Mimir and Prometheus, and TraceQL for Tempo.
From the dashboard’s left sidebar, select Explore, then choose your preferred data source from the dropdown menu at the top.
For Loki and Prometheus, click the Code section. For Tempo, select TraceQL. Type your query and press Shift + Enter to run it.
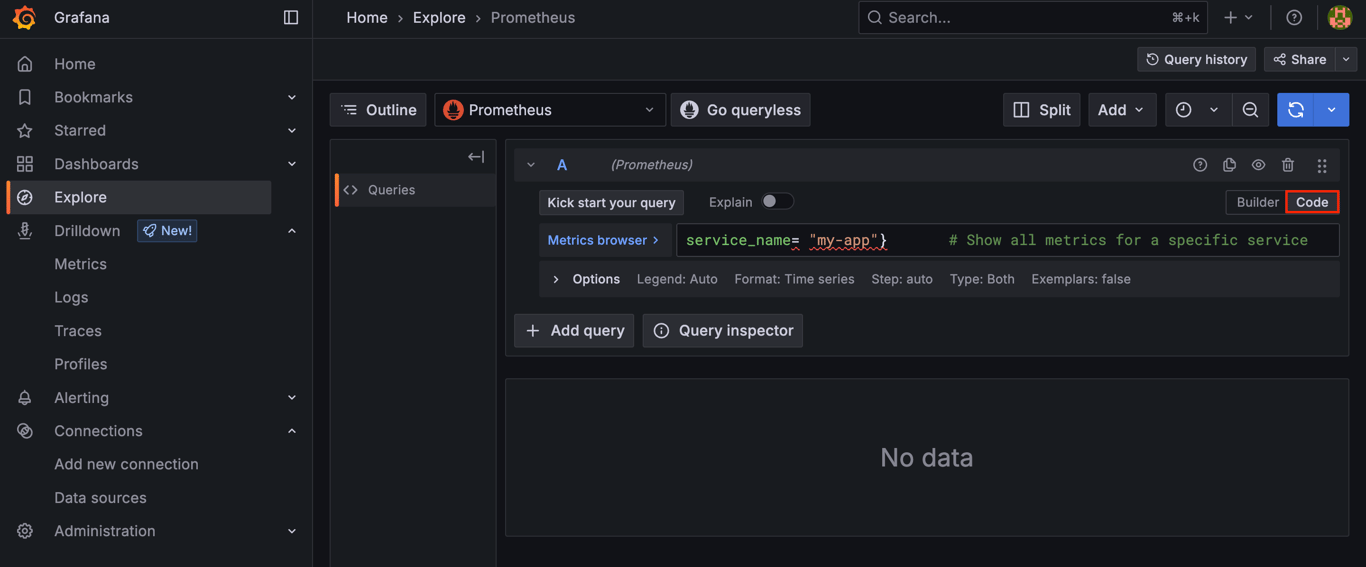
Here are some basic query examples for each data source:
Loki
{service_name= "my-app"}       # Show all logs for a specific service
{service_name="my-app"} |= "debug"  # Show only debug logs
Explore more queries in the LogQL official documentation.
Mimir and Prometheus
{service_name= "my-app"}       # Show all metrics for a specific service
process_cpu_usage{service_name="my-app"}  # Show CPU usage
Find advanced query examples in the PromQL documentation.
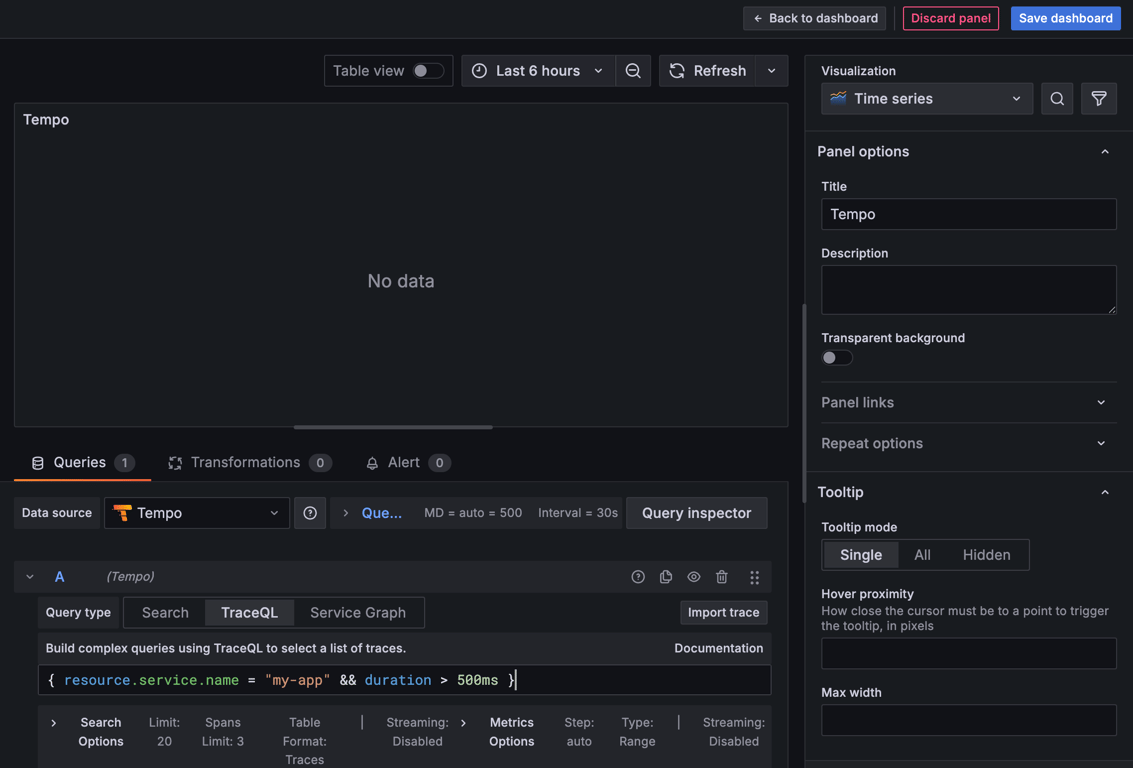
Tempo
{ resource.service.name = "my-app" && status = error }         # Show error traces for a specific service
{ resource.service.name = "my-app" && duration > 500ms }      # Show traces with long durations
Learn more about basic and advanced TraceQL queries on its documentation page.
9. Create a unified observability dashboard
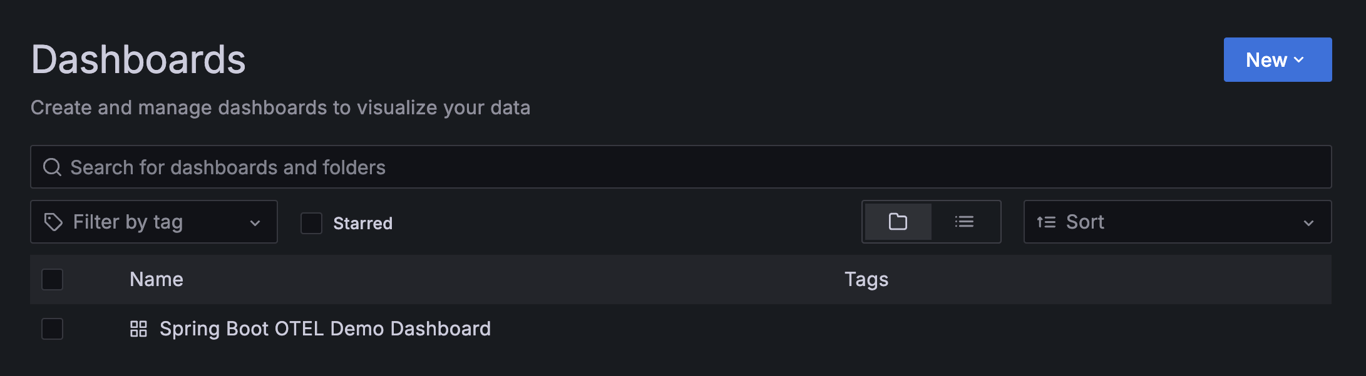
Open the Dashboards menu in the left sidebar to visualize your metrics, logs, and traces in one comprehensive view.
If you set up the LGTM stack using Docker Compose, you already have a sample dashboard that provides a quick overview of memory usage and logs for apps instrumented with OpenTelemetry.
You can also create a new dashboard by clicking New → New dashboard → Add visualization.
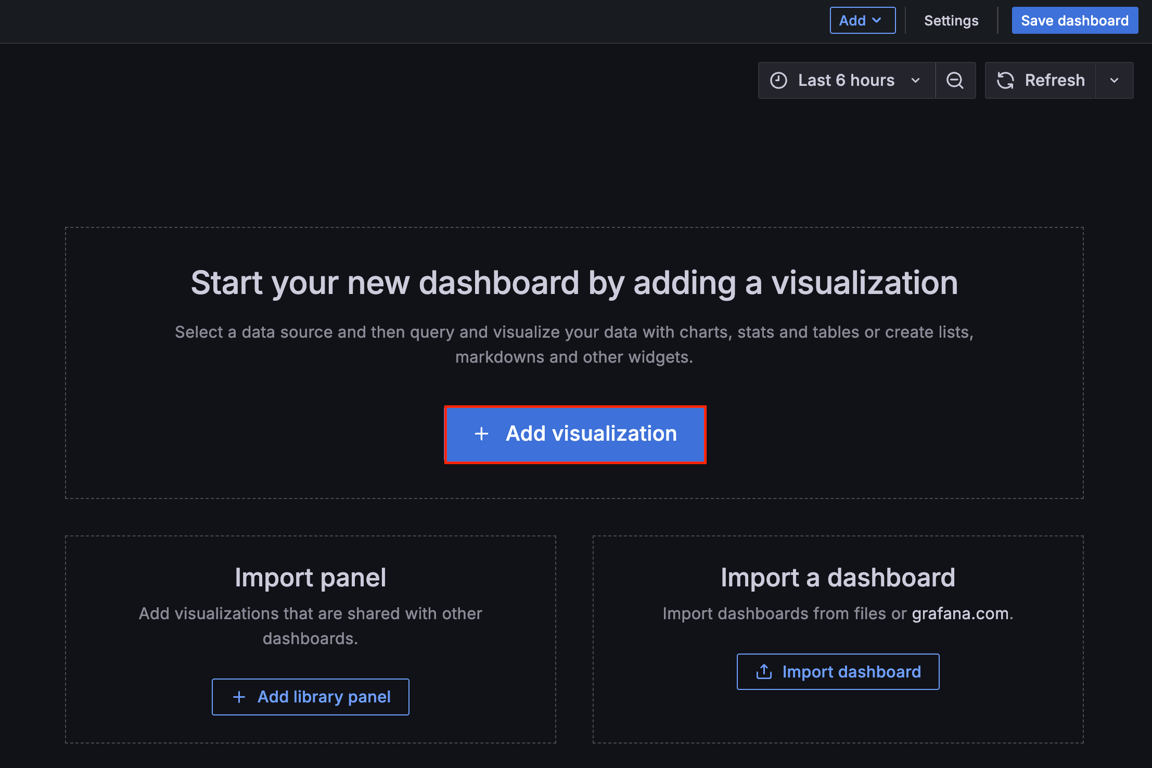
Next, select a data source from your components. In the panel editor, rename the panel to reflect the component name, then type your query in the dedicated field to display the desired data.
Once done, click Back to dashboard → Add → Visualization and repeat this process to add panels for all components.
After adding panels, use the resize handle in the bottom-right corner of each panel to adjust its width and height. When you finish customizing, hit Save dashboard and give it a name to save your work.
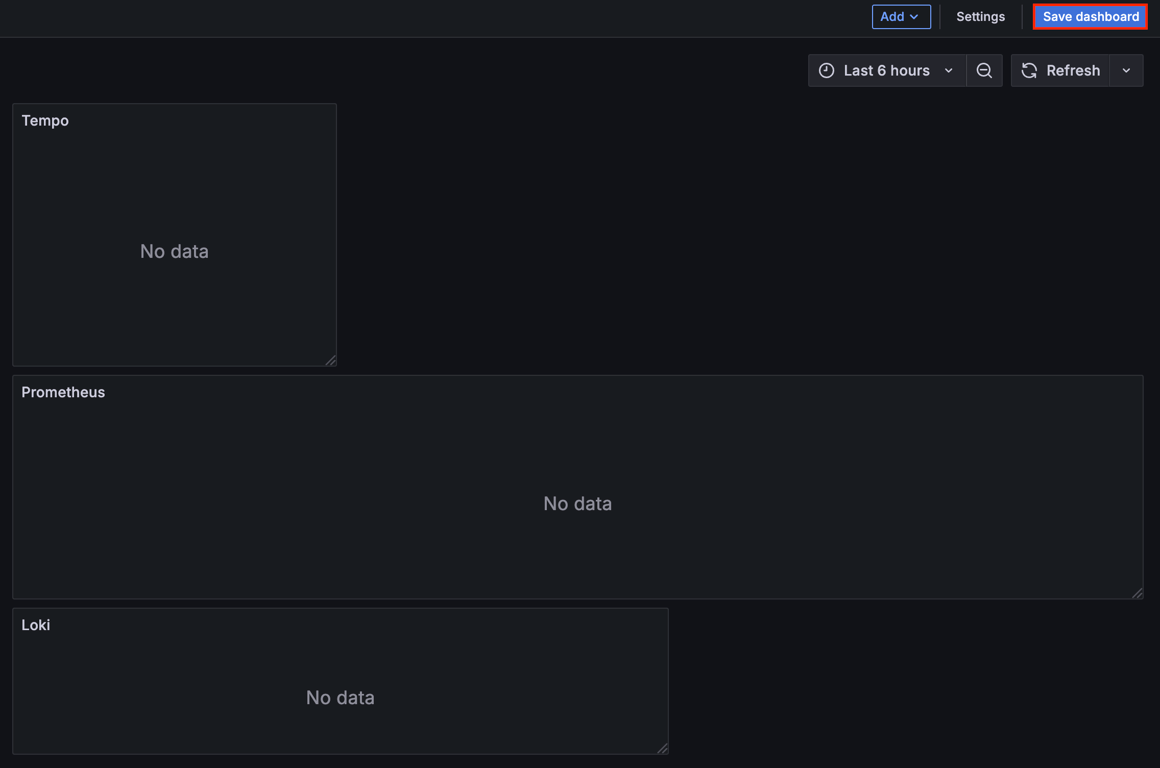
10. Add apps to the observability system
In the previous step, you saw that the dashboard was empty because you had yet to add any apps to monitor.
There are several ways to do so. Since you set up the stack using Docker Compose, we’ll guide you through adding the OpenTelemetry Collector.
It’s a vendor-neutral agent that collects telemetry data from your apps and forwards it to the right components in a standardized way.
To set up OpenTelemetry Collector, open your terminal and navigate to the grafana-lgtm directory. Then, create a file named otel-collector-config.yaml using nano:
cd grafana-lgtm
sudo nano otel-collector-config.yaml
Add the following configuration to the file. This setup receives data from your apps and routes it to the correct components:
receivers:
  otlp:
    protocols:
      http:
        endpoint: 0.0.0.0:4318    # Listen on OTLP/HTTP, port should match the Compose definition
      grpc:
        endpoint: 0.0.0.0:4317    # Listen on OTLP/gRPC, optional

processors:
  batch: {}  # Batch processor, sends telemetry data in batches to improve performance

exporters:
  # Export metrics as a Prometheus scraping endpoint
  prometheus:
    endpoint: "0.0.0.0:9464"
    # Enable conversion of Resource attributes to metric labels, ensuring service.name etc. appear in Prometheus labels
    resource_to_telemetry_conversion:
      enabled: true

  # Export logs to Loki via OTLP HTTP (using Loki's native OTLP log receiver)
  otlphttp/loki:
    endpoint: "http://loki:3100/loki/api/v1/push"  # Loki's OTLP log receiver HTTP API
    # Loki receives OTLP logs using otlphttp exporter

  # Export traces to Tempo via OTLP HTTP
  otlphttp/tempo:
    endpoint: "http://tempo:3200/v1/traces"

# Define processing pipelines for each type of telemetry data
service:
  pipelines:
    metrics:
      receivers: [otlp]
      processors: [batch]
      exporters: [prometheus]        # Metrics are processed and exposed in Prometheus format
    logs:
      receivers: [otlp]
      processors: [batch]
      exporters: [otlphttp/loki]     # Logs are processed and sent to Loki (OTLP HTTP)
    traces:
      receivers: [otlp]
      processors: [batch]
      exporters: [otlphttp/tempo]     # Traces are processed and sent to Tempo (OTLP HTTP)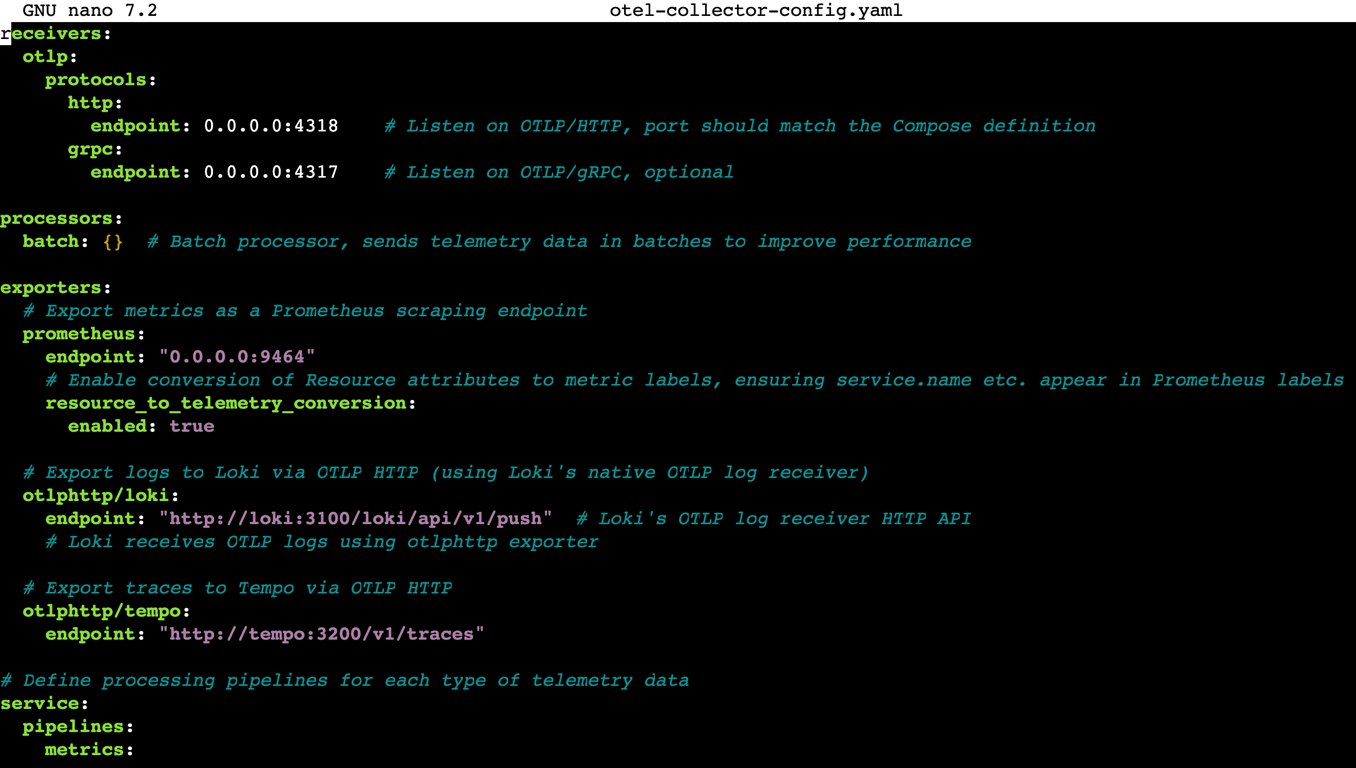
Next, edit your docker-compose.yml file and add the otel-collector service under the existing services section:
  otel-collector:
    image: otel/opentelemetry-collector-contrib:latest
    container_name: otel-collector
    volumes:
      - ./otel-collector-config.yaml:/etc/otel-collector-config.yaml:ro
    command: ["--config", "/etc/otel-collector-config.yaml"]
    ports:
      - "4318:4318"                   # OTLP HTTP
      - "9464:9464"                   # Prometheus metrics
    depends_on:
      - prometheus
      - loki
      - tempo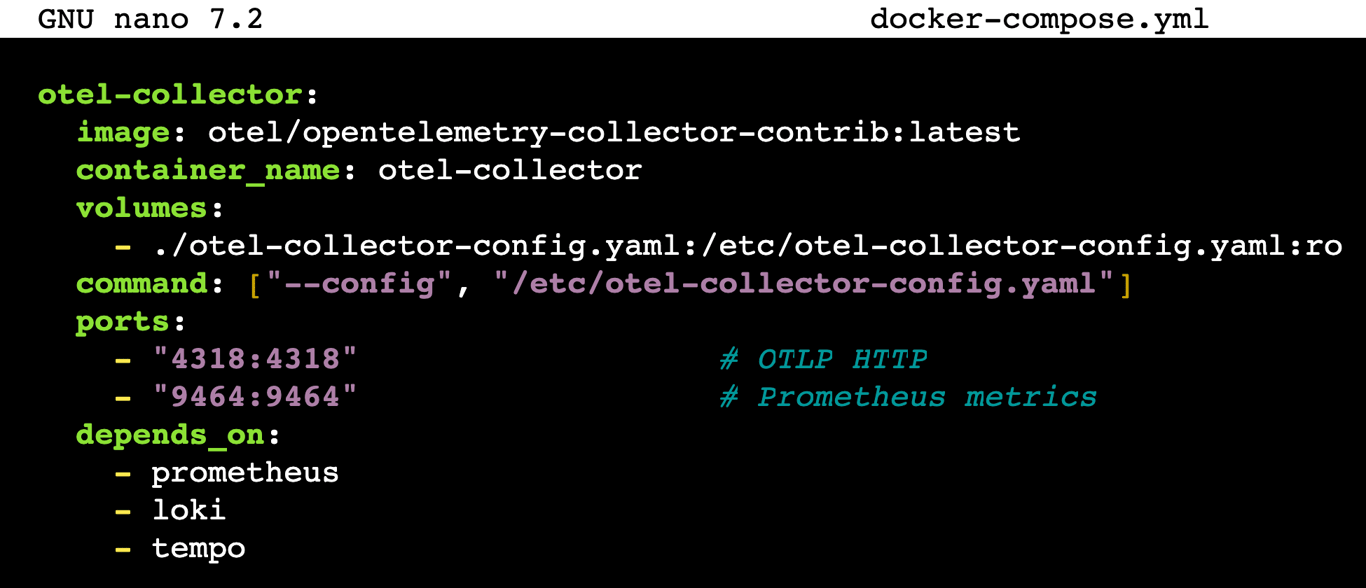
After updating the Compose file, restart all services to apply the changes:
docker compose down -v
docker compose up -d
Next, configure your app to send telemetry data to the OpenTelemetry Collector. This depends on your app’s language and framework. For example:
Node.js-based apps
Install the required OpenTelemetry packages:
npm install @opentelemetry/sdk-node @opentelemetry/exporter-trace-otlp-http @opentelemetry/exporter-metrics-otlp-http @opentelemetry/exporter-logs-otlp-http
Add this initialization code to your app:
const { NodeSDK } = require('@opentelemetry/sdk-node');
const { OTLPTraceExporter } = require('@opentelemetry/exporter-trace-otlp-http');
const { OTLPMetricExporter } = require('@opentelemetry/exporter-metrics-otlp-http');
const { OTLPLogExporter } = require('@opentelemetry/exporter-logs-otlp-http');
const sdk = new NodeSDK({
traceExporter: new OTLPTraceExporter({
url: 'http://localhost:4318/v1/traces'
}),
metricExporter: new OTLPMetricExporter({
url: 'http://localhost:4318/v1/metrics'
}),
logExporter: new OTLPLogExporter({
url: 'http://localhost:4318/v1/logs'
}),
serviceName: 'my-nodejs-app'
});
sdk.start();
Java-based apps
Download the OpenTelemetry Java agent:
curl -L -o opentelemetry-javaagent.jar https://github.com/open-telemetry/opentelemetry-java-instrumentation/releases/latest/download/opentelemetry-javaagent.jar
Run your app with the agent attached, replacing my-app with your service name:
java -javaagent:opentelemetry-javaagent.jar \

-Dotel.exporter.otlp.endpoint=http://localhost:4318 \

-Dotel.resource.attributes=service.name=my-app \

-jar your-application.jar
Return to your Grafana dashboard to see your app’s telemetry data flowing in. This gives you real-time insights into its performance, logs, and traces.
Conclusion
The LGTM stack unifies logs, metrics, traces, and visualization in one place. This integration helps you monitor complex systems more effectively, troubleshoot issues faster, and gain actionable insights to optimize performance.
In this guide, we’ve covered how to set up the LGTM stack on a VPS:
- Prepare your server environment.
- Install and configure Loki to collect logs.
- Set up Mimir to gather metrics.
- Deploy Tempo to trace distributed requests.
- Integrate Grafana for centralized visualization.
- Define services using Docker Compose.
- Log in to the Grafana dashboard.
- Query your data sources.
- Create a comprehensive observability dashboard.
- Connect your apps via OpenTelemetry Collector.
To expand your observability setup, try using LogQL, TraceQL, and PromQL for advanced queries. You can also add alerting rules to your dashboard to receive notifications when performance metrics or logs reach critical thresholds.
LGTM stack FAQ
Why should I use the LGTM stack for observability?
The LGTM stack lets you visualize metrics, logs, and traces in a single platform. It simplifies monitoring, speeds up troubleshooting, and provides deeper insights to help you optimize system and app performance efficiently.
Is the LGTM stack open-source?
Yes. The LGTM stack is fully open source. Its components – Loki, Grafana, Tempo, and Mimir – are maintained by Grafana Labs and the developer community, allowing free use, customization, and contribution.
Can I integrate the LGTM stack with other tools?
Yes. You can integrate the LGTM stack with various observability and monitoring tools, like OpenTelemetry Collector, through standard protocols and exporters. This enables flexible data collection and visualization alongside your existing systems.
All of the tutorial content on this website is subject to Hostinger's rigorous editorial standards and values.

Ariffud is a Technical Content Writer with an educational background in Informatics. He has extensive expertise in Linux and VPS, authoring over 200 articles on server management and web development. Follow him on LinkedIn.

Valentinas Čirba, Hostinger's Head of VPS, is a seasoned product leader specializing in VPS products with over ten years of experience. He's an expert at setting product strategy, leading cross-functional teams, and making smart decisions to deliver innovative solutions. Valentinas is committed to creating products that not only meet business objectives but also truly serve the customer. Follow him on LinkedIn.