How to install Grafana Mimir for scalable metrics storage
Jun 19, 2025
/
Dovydas
/
5 min Read
Grafana Mimir is a high-performance, Prometheus-compatible backend designed for scalable, long-term metrics storage and querying. It’s ideal for setups where Prometheus alone can’t handle the volume or retention requirements of your metrics. With Grafana Mimir, you can efficiently scale your monitoring system and store vast amounts of metrics data over extended periods.
In this guide, we will show you how to:
- Install Grafana Mimir on Ubuntu Linux, setting up a monolithic, single binary mode installation.
- Configure Grafana Mimir for optimal performance and data storage.
- Integrate Prometheus to forward metrics to Grafana Mimir.
- Connect Grafana Mimir to Grafana for seamless data visualization.
Whether you’re testing Grafana Mimir in a lab environment or setting up a small deployment for your system’s monitoring, this article will walk you through each step of the process to get everything up and running, ensuring effective metrics storage and visualization.
Prerequisites
Before you begin, make sure you have the following:
- An Ubuntu 20.04 or newer system (a local server or VPS with sudo access works fine).
- Basic experience with the Linux terminal.
- Essential tools like wget.
- Grafana installed either using a Hostinger VPS template or manually.
1. Install dependencies
To install Mimir on Ubuntu, you’ll need two basic tools: wget to download files and tar to unpack them. You can install both by running sudo apt update followed by sudo apt install wget tar -y.
Mimir communicates over several ports, including 9009 and 9095. If Uncomplicated Firewall (UFW), the default firewall service on Ubuntu, is active on your server, run sudo ufw allow 9009 and sudo ufw allow 9095 to make those available.
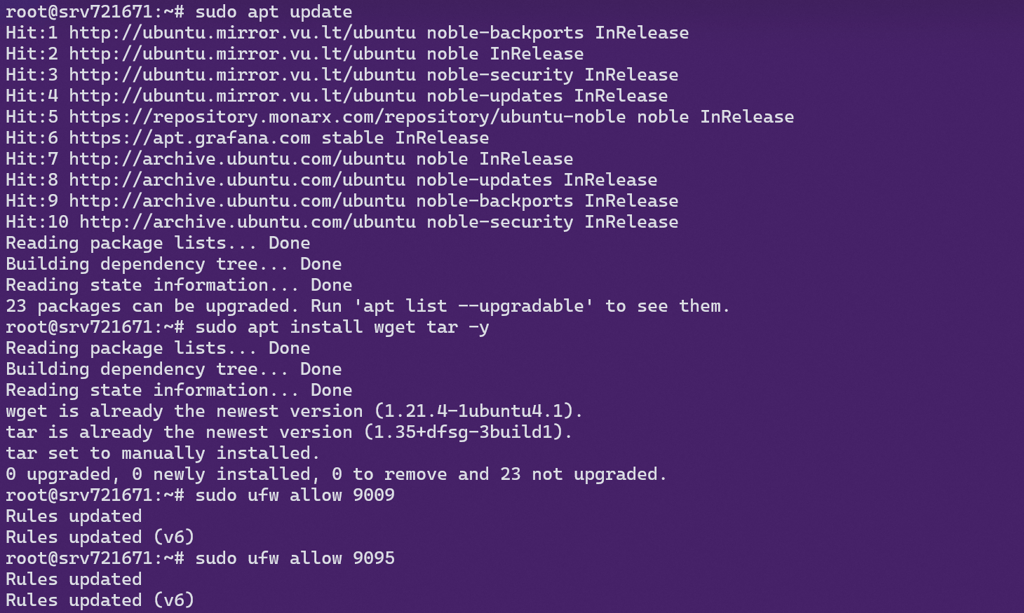
Port 9009 is where Prometheus sends metrics over regular web traffic for Grafana to read them, while port 9095 is used for Mimir’s internal communication between components.
2. Download and install Mimir
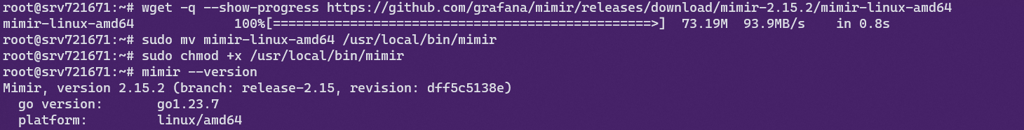
Head to the Grafana Mimir releases page and grab the latest Linux AMD64 binary, named mimir-linux-amd64. Copy the link to the file, then run wget followed by the copied URL. For example:
wget -q --show-progress https://github.com/grafana/mimir/releases/download/mimir-2.15.2/mimir-linux-amd64
Once downloaded, move the binary to a location in your system’s PATH environment variable. You can rename it while moving it to keep things clean:
sudo mv mimir-linux-amd64 /usr/local/bin/mimir
Then make it an executable with:
sudo chmod +x /usr/local/bin/mimir
To verify the install, run mimir –version. If you see version info, the binary is good to go.
3. Configure Mimir
Mimir is designed to run as a collection of services. Each service handles a different job, like storage, querying, or ingestion. But for some setups, especially when you’re just getting started, running it in single-binary mode makes life easier. This mode combines everything into one executable, so you don’t have to wire up multiple components.
To run Mimir in single-binary mode, you’ll need a basic configuration file written in YAML. Create one at /etc/mimir/mimir.yaml using the command below:
sudo mkdir -p /etc/mimir

sudo tee /etc/mimir/mimir.yaml > /dev/null <<EOF

server:

  http_listen_address: 0.0.0.0

  http_listen_port: 9009

limits:

  max_label_name_length: 1024

  max_label_value_length: 2048

  max_label_names_per_series: 30

blocks_storage:

  backend: filesystem

  filesystem:

    dir: /var/lib/mimir

memberlist:

  bind_addr:

    - 127.0.0.1

ingester:

  ring:

    replication_factor: 1

EOF
Pay attention to three sections in the config:
- Server block sets the port. Typically, 0.0.0.0:9009 is a default value.
- The Limits section helps control resource use. This is especially useful on smaller servers.
- The Blocks storage block tells Mimir where to keep your metrics. In our case, we set Mimir to store data locally.
- The Memberlist block configures internal service discovery and communication. Here we define the network interface that Mimir uses for internal traffic.
- The Ingester ring sets the number of ingesters to which each time series is replicated. Since our setup is on a single machine, we need to specify one.
You will point Mimir to this file using the -config.file flag in the launch command later.
4. Start Mimir automatically
Since you’ve installed Mimir from a binary, you need to manually add a systemd service to run it in the background and make sure it starts on boot.
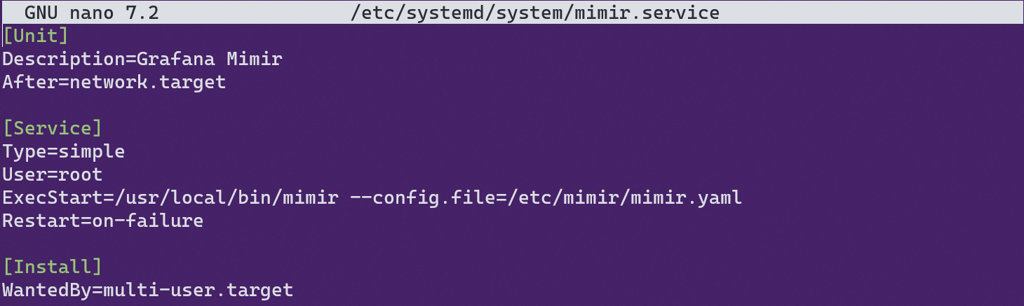
Create a new file at /etc/systemd/system/mimir.service and add:
[Unit]
Description=Grafana Mimir

After=network.target

[Service]

Type=simple

User=root

ExecStart=/usr/local/bin/mimir --config.file=/etc/mimir/mimir.yaml

Restart=on-failure

[Install]

WantedBy=multi-user.target
Then, reload systemd to pick up the new file:
sudo systemctl daemon-reexec
Enable the service and start it:
sudo systemctl enable mimir

sudo systemctl start mimir
Check if it’s running with:
sudo systemctl status mimir
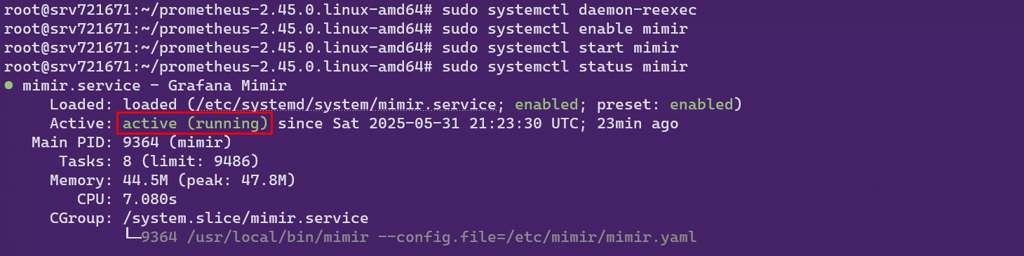
Mimir will stay up and automatically start after your machine reboots.
5. Connect Prometheus to Mimir
If you already have Prometheus set up, you can forward its metrics to Mimir for long-term storage by adding a remote_write block to your Prometheus config.
Open your /etc/prometheus/prometheus.yml file and add this section near the bottom:
remote_write:

  - url: http://localhost:9009/api/v1/push

    headers:

      X-Scope-OrgID: anonymous
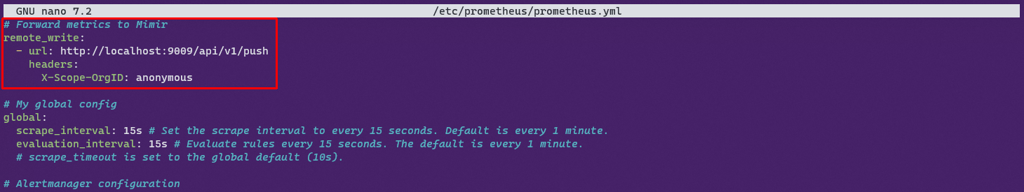
This tells Prometheus where to forward the data it collects. If Prometheus and Mimir are on different machines, you’ll need to change localhost to the actual IP address of your Mimir server.
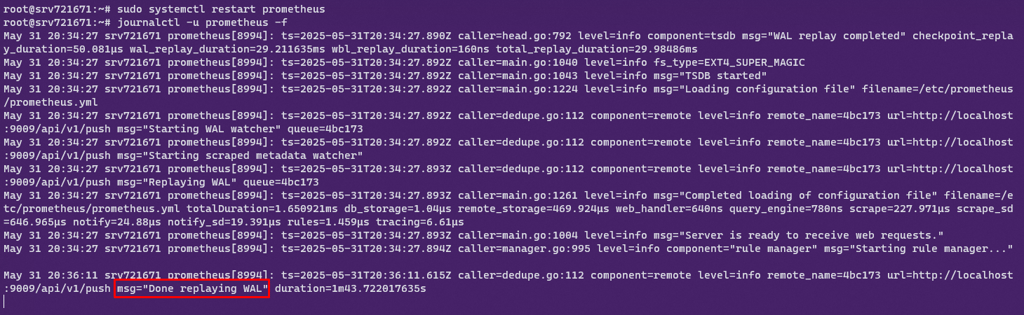
After saving the file, restart Prometheus for the change to take effect:
sudo systemctl restart prometheus
After the restart, inspect the logs. Look for messages that show metrics are being pushed via remote_write. Once connected, Prometheus will start sending data to Mimir automatically.
journalctl -u prometheus -f
6. Add Mimir to Grafana
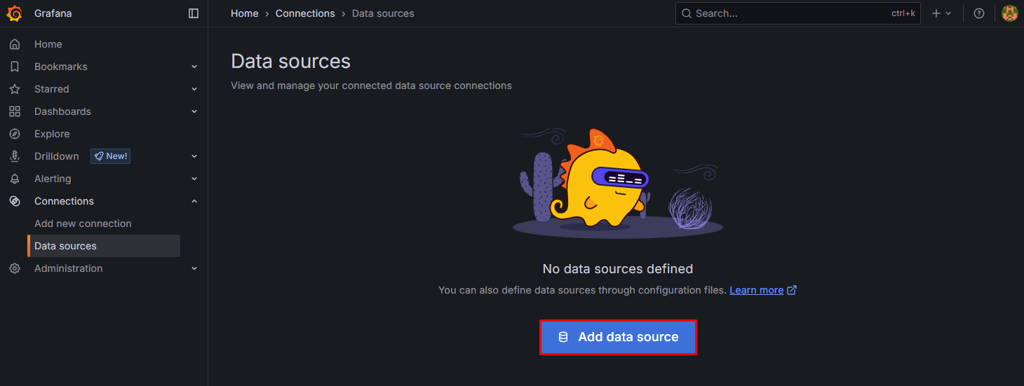
To visualize your metrics, connect Mimir to Grafana using the Prometheus data source type. Although Mimir is a separate project, it’s fully compatible with the Prometheus API, so you won’t need any custom plugin.
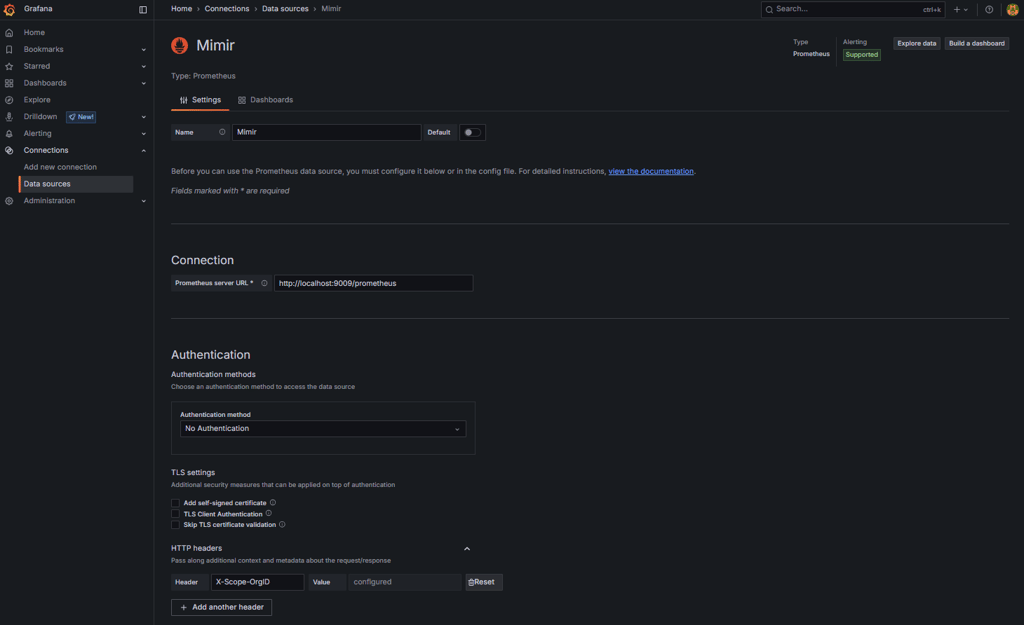
In Grafana, navigate to Connections → Data Sources, then click Add data source and select Prometheus.
In the URL field, enter:
http://localhost:9009/prometheus
In the HTTP Headers section, add the following:
- Header: X-Scope-OrgID
- Value: anonymous
The header is required because Mimir uses multi-tenancy by default. Without the X-Scope-OrgID header, your queries will be rejected with a 401 Not authorized error.
Scroll down and click Save & Test. If Mimir is set up correctly and Prometheus is pushing data, Grafana will display a success message confirming the connection.

7. Test the installation
Open Grafana and go to the Explore tab to confirm that Mimir is receiving and storing metrics correctly. At the top, make sure the data source is set to Mimir. In the Metric field, select the up metric and click Run query.
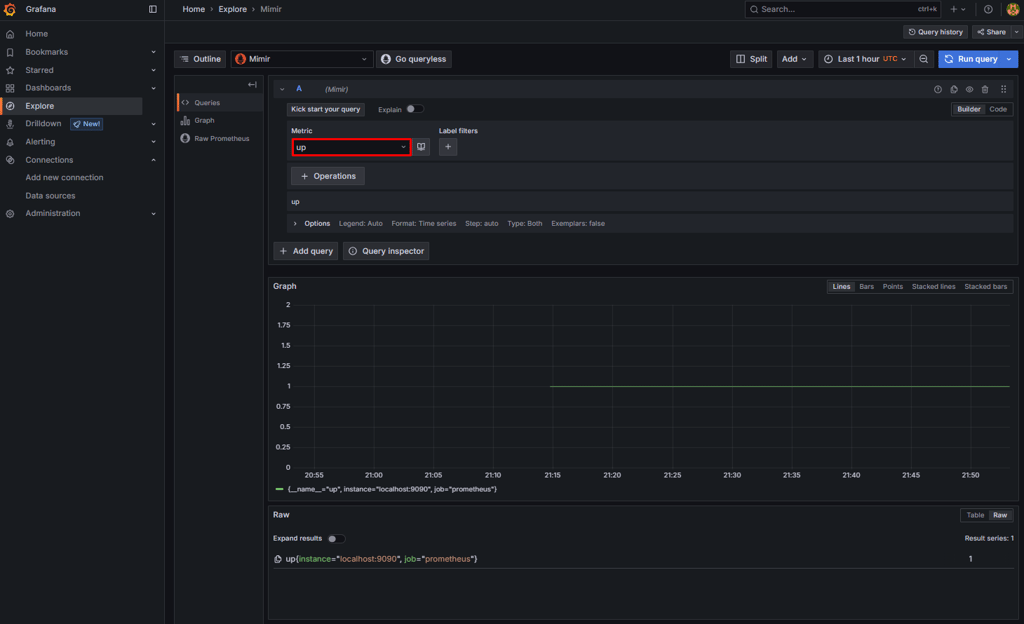
If Prometheus is pushing metrics, you’ll see the status of the Prometheus instance itself. This confirms that Mimir is storing metrics and that Grafana can read them.
If the query returns no data and you have configured the remote_write block correctly, double-check that both Prometheus and Mimir are running, or try restarting the services using sudo systemctl restart prometheus and sudo systemctl restart mimir commands.
Conclusion
You’ve now set up a working observability pipeline with Grafana Mimir at the core. You installed Mimir on an Ubuntu Linux server, configured it to run in single binary mode, connected Prometheus to forward metrics, and visualized the data in Grafana.
This gives you a solid starting point to explore Mimir and understand how it fits into a Prometheus-based monitoring stack.
From here, you can scale things up by separating Mimir’s components, switching to object storage, or adding alerting and recording rules. To complete your observability setup with log aggregation and search, consider installing Loki – Grafana’s logging system that pairs seamlessly with Mimir.
How to install Grafana Mimir FAQ
What is Mimir?
Grafana Mimir stores and manages Prometheus metrics at scale, preventing overload on local setups. It integrates with Grafana, supports PromQL, and is built for large environments. Mimir is ideal for reliable metrics storage across multiple systems or users.
What is Grafana Mimir used for?
Grafana Mimir helps scale Prometheus metrics beyond a single server, storing large data volumes, supporting multiple users, and simplifying metric management. When paired with Grafana, it powers dashboards and enables long-term system monitoring.
Can I use Grafana Mimir without Prometheus?
Grafana Mimir can’t replace Prometheus because Mimir doesn’t collect metrics on its own – it works alongside it. It’s made to store and query data sent from Prometheus or similar tools. If you don’t use Prometheus, you’ll need another system that can send metrics in the same format.
All of the tutorial content on this website is subject to Hostinger's rigorous editorial standards and values.

Dovydas has worked in cloud engineering and IT operations, focusing on maintaining and improving complex systems. He’s especially interested in software development and automation and is always looking for ways to make things more efficient and reliable. You can find him on LinkedIn.