How to install Grafana on Ubuntu?
Aug 26, 2025
/
Alanas M. & Valentinas C.
/
6 min Read

Grafana is a free visualization tool that displays complex data from various sources in a single, unified platform. Some popular data sources that Grafana supports include Prometheus, Loki, MySQL, Elasticsearch, CloudWatch, and Jira.
Due to its lightweight design and strong community support, Grafana is a valuable tool widely used in organizations of all sizes.
This guide will teach you how to install Grafana on a Hostinger Ubuntu VPS with the one-click template or manual installation. In just a few simple steps, you’ll have one of the leading observability tools ready to use with your data.
Prerequisites
Before you start installing Grafana, make sure your VPS meets the following requirements:
- Ubuntu 20.04 or later
- Internet access to retrieve packages
The recommended system resources for Grafana are:
- 1 vCPU
- 512 MB RAM
Hostinger’s entry-level KVM 1 VPS hosting plan gives you more than enough resources for this purpose, starting at $6.49/month. Grafana is highly efficient on its own. Data sources handle most of the resource load, while the features provided by Grafana do not stress system resources.
Pro tip
We recommend allocating more resources if you want a more advanced setup, such as replacing the default SQLite database with a PostgreSQL database.
You’ll also need:
- Basic familiarity with the command-line interface
- Permission to edit configuration files
- Permission to manage system services

How to install Grafana with the Hostinger VPS template?
The most straightforward way to install Grafana on your Ubuntu VPS is with Hostinger’s one-click installation template for Grafana. Let’s go through the installation process:
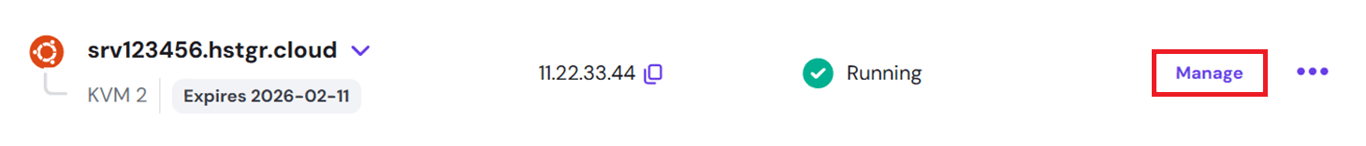
- Log in to hPanel and in the VPS section, click Manage on your VPS:
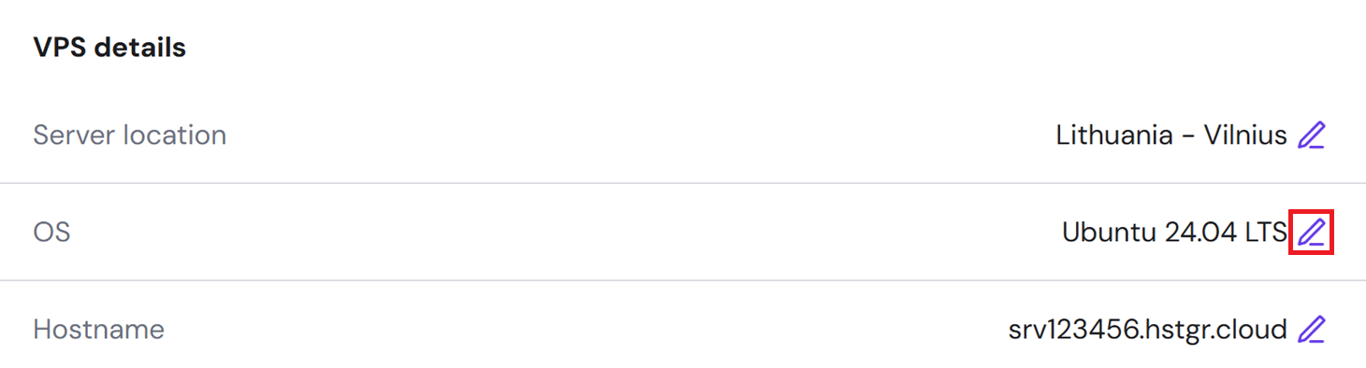
- Under VPS details, click the Edit icon next to the operating system entry:
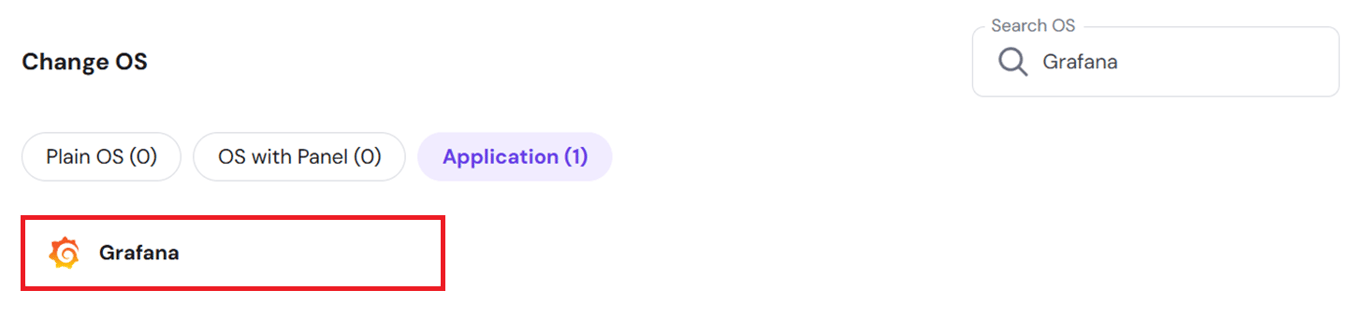
- In the search bar, type Grafana and select the Grafana OS option that is returned:
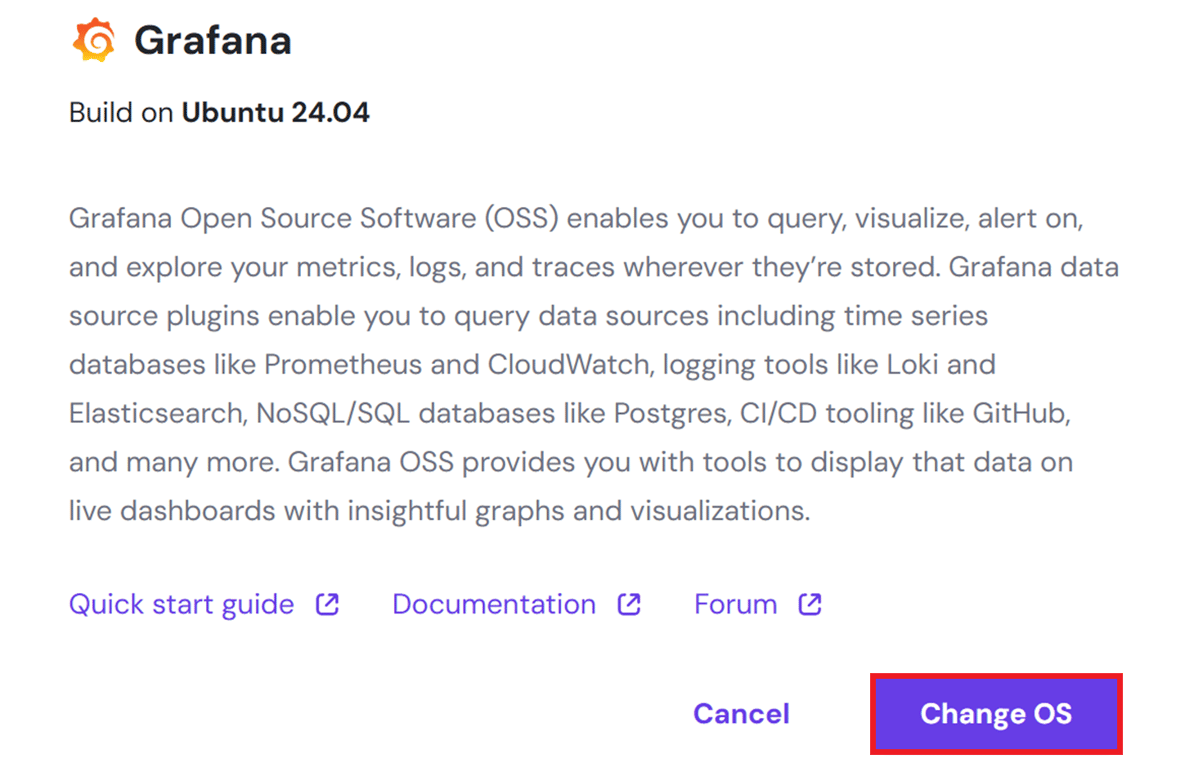
- In the pop-up window, click Change OS:
- Proceed with the operating system reinstallation steps, acknowledging that reinstallation will result in data loss and setting up a new password.
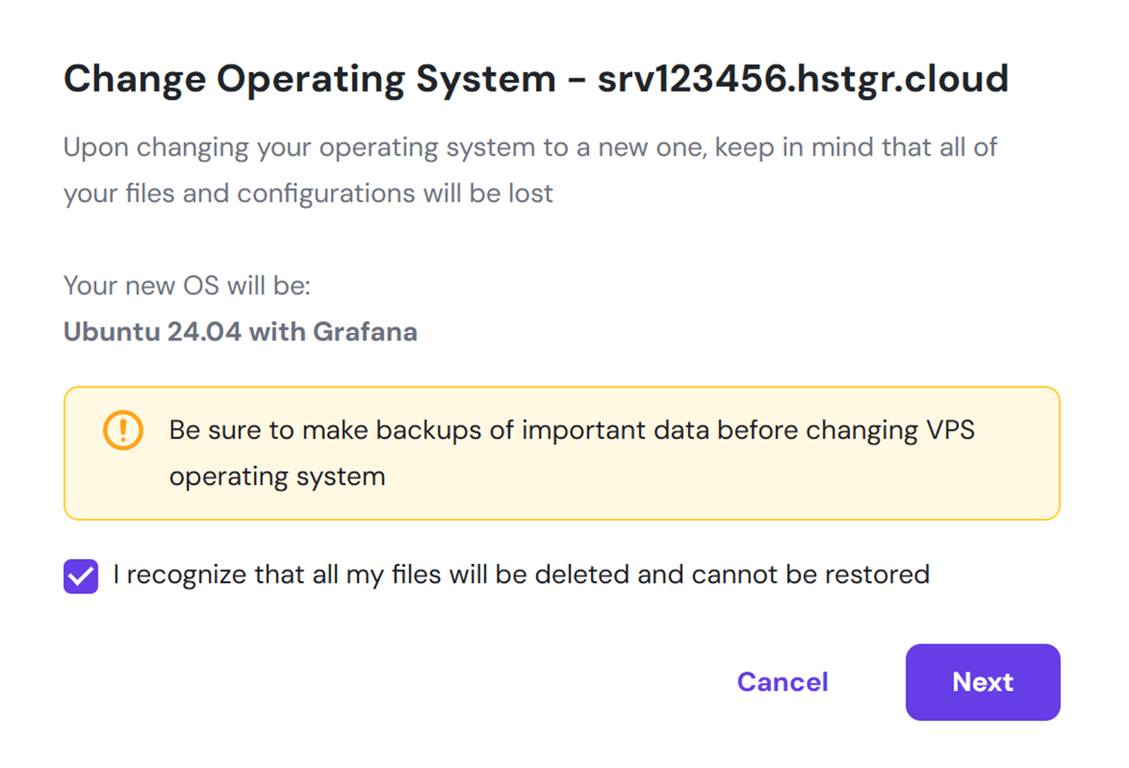
- Wait for the OS reinstallation to complete.
Once the OS reinstallation is complete, click Manage App:
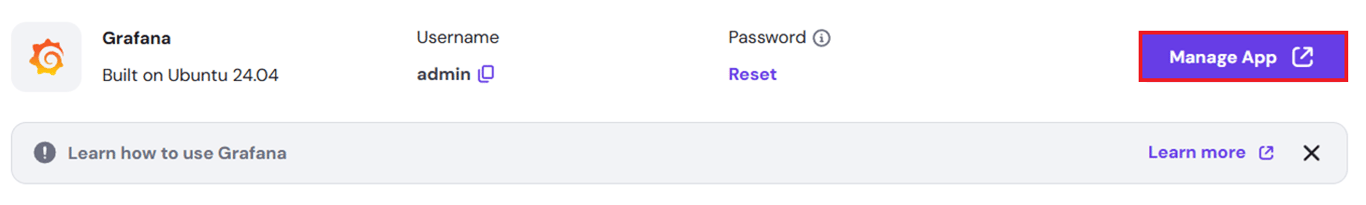
You will then enter the Grafana web interface. On the login page, enter your credentials: your username will be admin, and the default password will match the password you set for the root user during OS setup.
How to install Grafana manually?
Grafana can be installed in several ways – as a simple system service, in a Docker container, or as part of a high-availability setup. In this guide, we’ll keep things straightforward and install it as a service on a VPS running Ubuntu 24.04.
1. Update your system
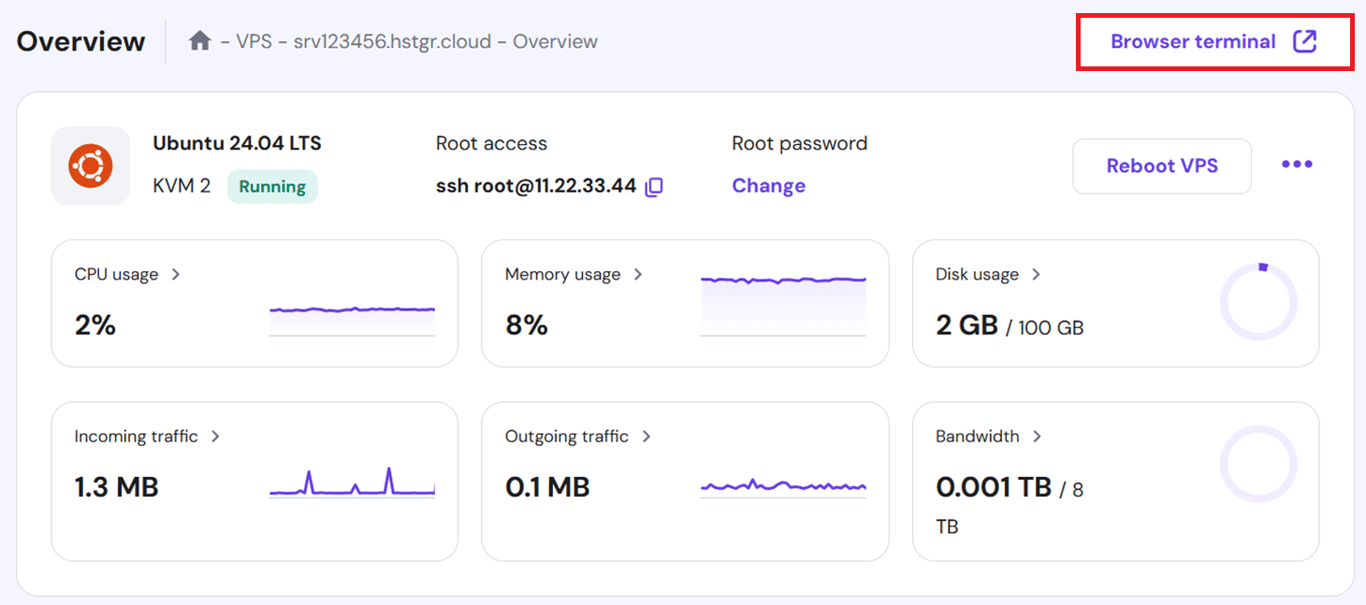
To install Grafana, you must first access your VPS using your preferred method. Here, we’ll access it through hPanel’s built-in browser terminal functionality, but you can also directly connect to your instance with SSH.
- Log in to hPanel and in the VPS section, click Manage on your VPS:

- Click the Browser terminal button.
- Enter your VPS credentials.
Then, you’ll need to update the system with the latest available packages. To do this, run these commands:
sudo apt update && sudo apt upgrade -y
This will refresh all available packages in your local package list and then upgrade them to the latest version.
We recommend running these commands before installing new software to ensure your system is up to date. An outdated package can cause conflicts or issues during installation.
2. Install required dependencies
Grafana’s installation relies on a few basic tools to handle external repositories and package downloads. These include:
- apt-transport-https – allows APT to access repositories over HTTPS
- software-properties-common – provides utilities for managing APT sources
- curl – used to download files from the command line
Modern Linux server distributions typically have these packages installed. However, it’s worth checking just in case.
You can easily check these packages by running dpkg -s <PackageName>. If the command is successful, it’ll return all available information on a package. For a missing package, you’ll receive the message dpkg-query: package ‘PackageName’ is not installed and no information is available.
You can use this script to check for the three required packages quickly:
dpkg -s curl >/dev/null 2>&1 && echo "curl is installed" || echo "curl is NOT installed"

dpkg -s software-properties-common >/dev/null 2>&1 && echo "software-properties-common is installed" || echo "software-properties-common is NOT installed"

dpkg -s apt-transport-https >/dev/null 2>&1 && echo "apt-transport-https is installed" || echo "apt-transport-https is NOT installed"
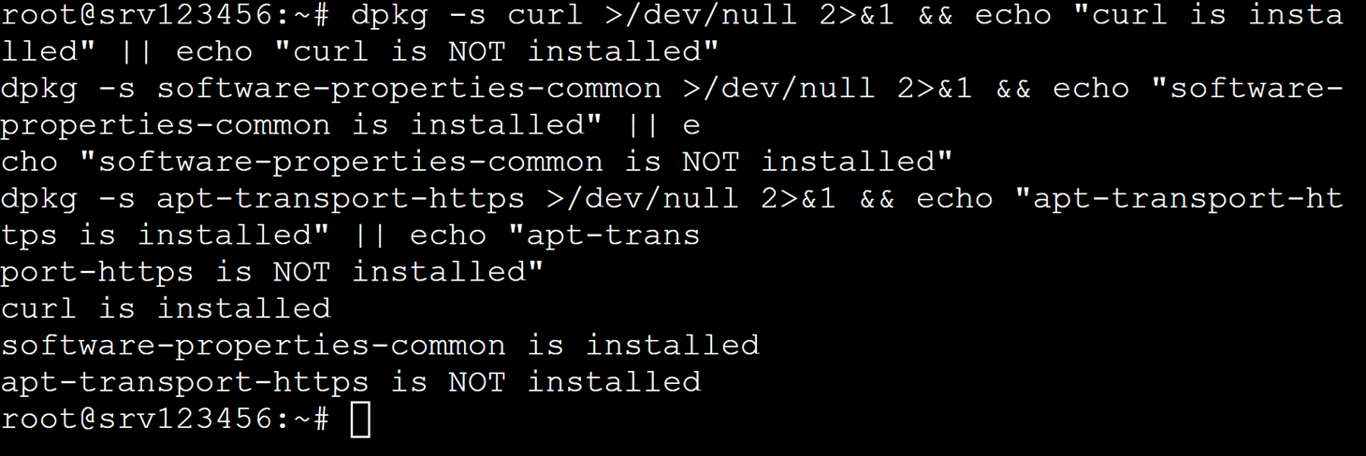
In our case, we see that apt-transport-https is missing. If you’re running Ubuntu 20.04 or later, it will likely have been merged into the apt package.
To verify this, run this command:
apt show apt | grep Version
If the version of the apt package is newer than 1.5, the separate apt-transport-https package is unnecessary as the apt package will have it bundled in.
On legacy Linux distributions, you can run sudo apt install apt-transport-https to fetch this package, or upgrade apt to the latest version.
3. Add Grafana’s official APT repository
To install Grafana with APT, you need to add the official Grafana APT repository to your system. Here’s how to do it:
- Download and add Grafana’s GPG key:
sudo mkdir -p /etc/apt/keyrings/

wget -q -O - https://apt.grafana.com/gpg.key | gpg --dearmor | sudo tee /etc/apt/keyrings/grafana.gpg > /dev/null
These commands download Grafana’s public GPG key and store it in a dedicated keyring. It ensures that the packages you’re installing are authentic.
- Add the Grafana APT repository:
echo "deb [signed-by=/etc/apt/keyrings/grafana.gpg] https://apt.grafana.com stable main" | sudo tee -a /etc/apt/sources.list.d/grafana.list
This command adds Grafana’s official APT repository to your system’s sources list and instructs it only to trust packages signed with the key you just added.
- Update the package index:
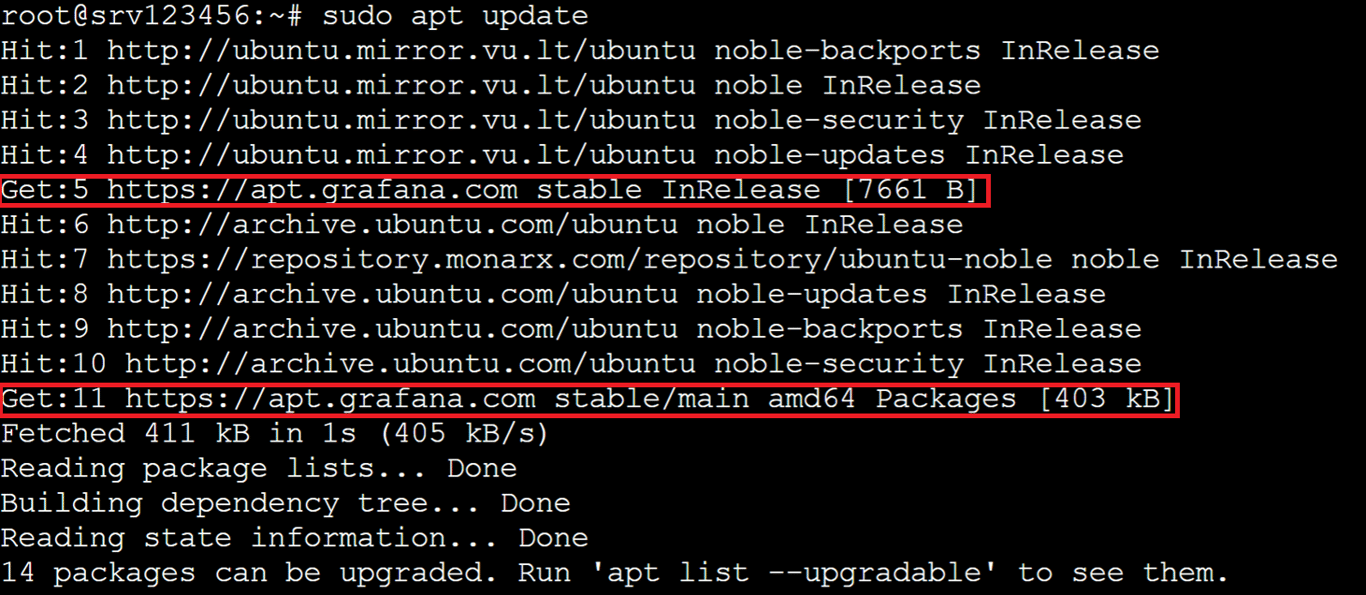
sudo apt update
This command refreshes your local package list to include the newly added Grafana repository so that APT can find and install the Grafana package.
You will now see that the Grafana package repository is added as a source for the command, which means that your system will recognise the latest Grafana packages.
4. Install Grafana
Now that the repository is in place, you can install Grafana using the standard APT package manager. Simply run this command:
sudo apt install grafana
When prompted, press Y and Enter:
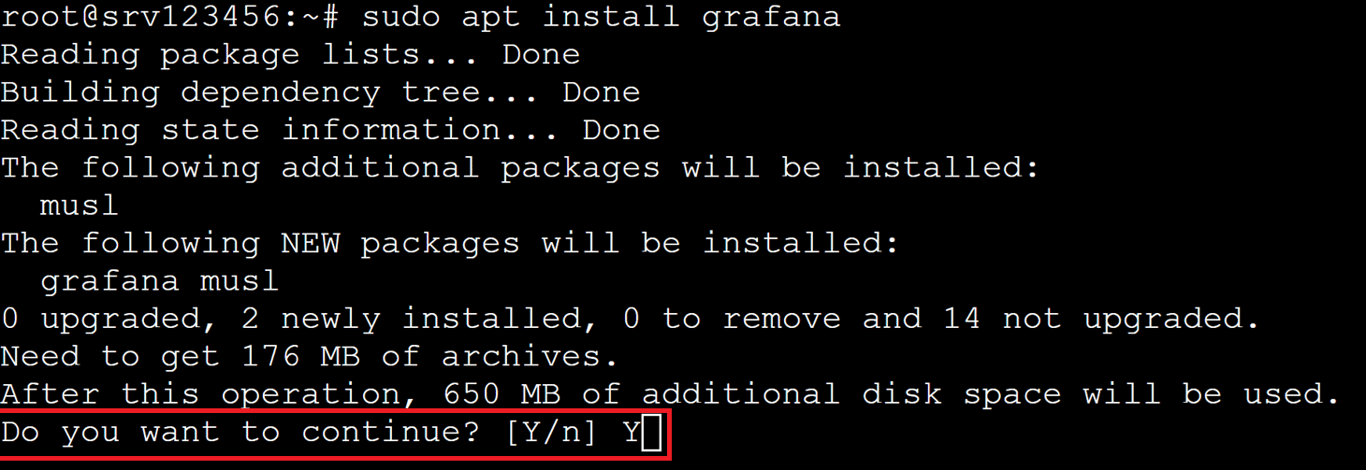
The installation will pull all the critical dependencies that Grafana requires and automatically create the needed directories. After it completes, run cd /etc/grafana and ls to check them
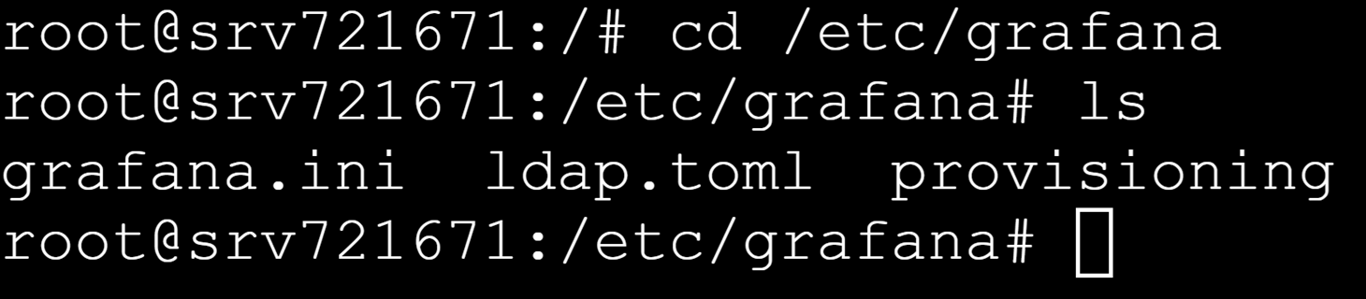
In this directory, you will see three entries:
- grafana.ini – this is the main configuration file for your Grafana server. It contains various configuration data for your instance that controls how Grafana behaves.
- ldap.toml – this file contains the Lightweight Directory Access Protocol (LDAP) configuration data, which you can use to secure your data further.
- provisioning – this folder contains predefined settings for your Grafana server, such as plugins, data sources, and dashboards.
You can fine-tune Grafana’s settings by modifying the grafana.ini file to better suit your needs. In this tutorial, we’ll proceed with the default configuration.
5. Enable and start the Grafana service
To start the Grafana service, run this command:
sudo systemctl start grafana-server
This will launch the Grafana server. By default, Grafana uses port 3000, but you can change this value in the grafana.ini configuration file.
To verify it started successfully, you can execute:
sudo systemctl status grafana-server
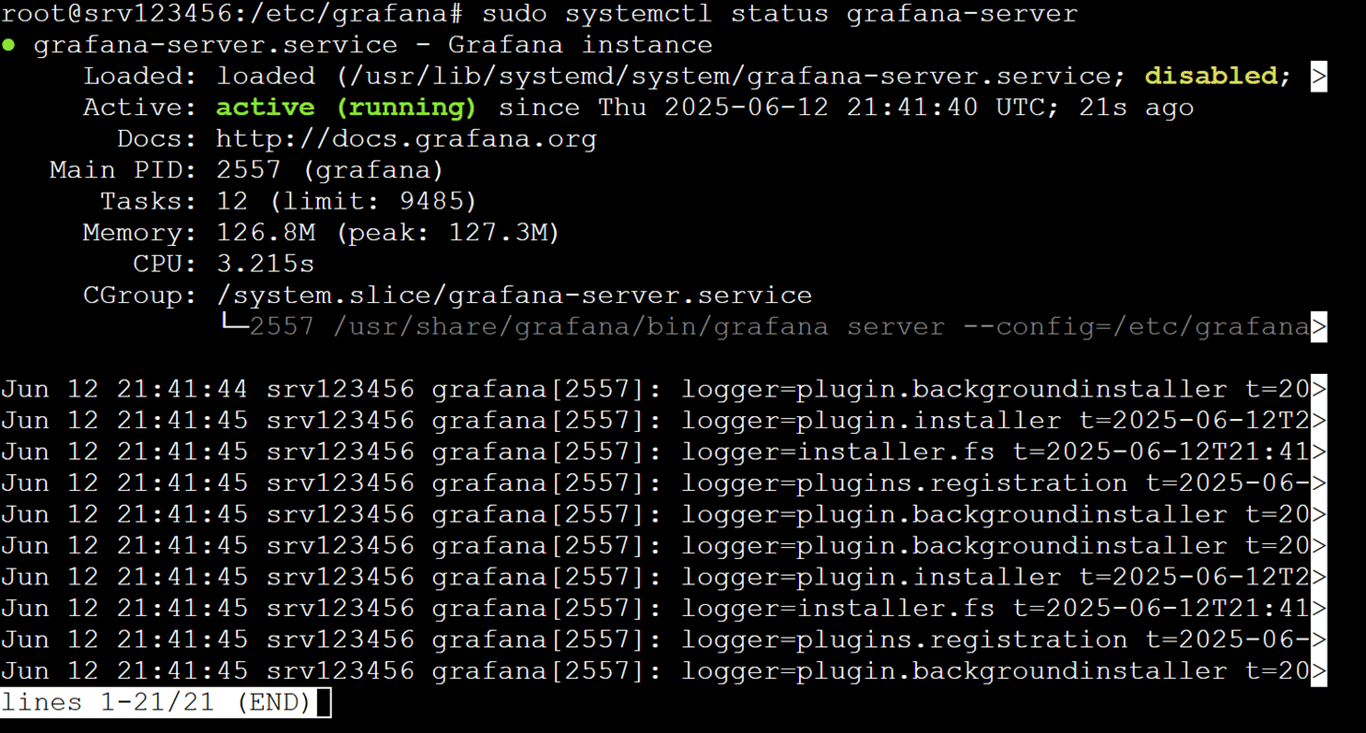
The main thing to look out for is the status of the Grafana process. You can see that it’s active (running), letting you know that Grafana is running correctly. You can also inspect the most recent logs of the Grafana service.
The next step is ensuring Grafana starts when your VPS starts, so you do not need to start it yourself. To do this, run:
sudo systemctl enable grafana-server
6. Access the Grafana dashboard
Now that Grafana is up and running, you can access it through your browser by entering the IP or hostname of your VPS and adding the :3000 port to the URL.
You will be greeted with Grafana’s web interface and will be able to log in.
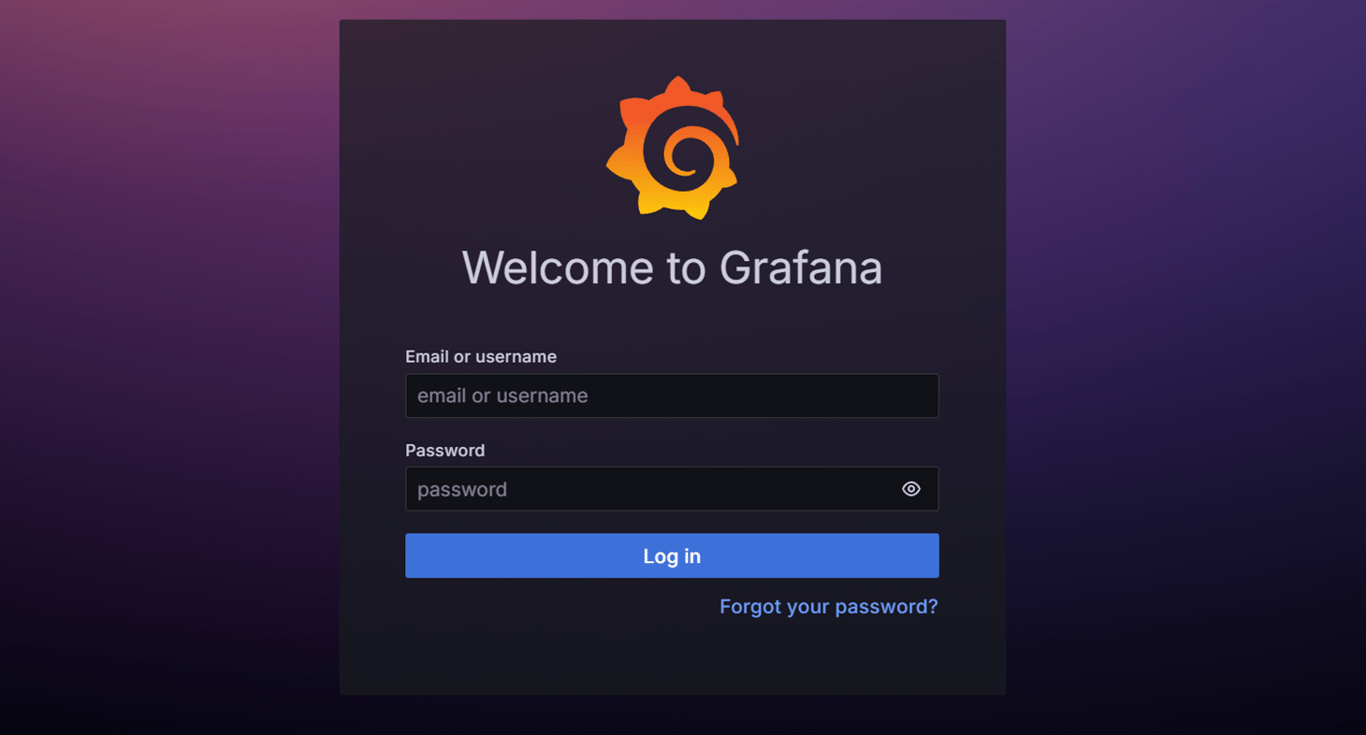
The default credentials are:
- Username: admin
- Password: admin
When you first log in, Grafana will prompt you to change your password from the default one, which we strongly recommend.
And that’s it, you have your very own Grafana instance!
Conclusion
The basic Grafana setup is just the beginning. It’s a versatile tool, but only as powerful as the data you give it.
You can add various data sources and plugins to populate your dashboards and get the most out of Grafana. You can also customize your setup by modifying the grafana.ini configuration file, so Grafana runs just as you’d like it to.
From here, it’s all about shaping Grafana to fit your use case – one data source, plugin, and dashboard at a time.
How to install Grafana FAQ
What is Grafana?
Grafana is an open-source data visualization platform for creating dashboards using various data sources. It allows you to monitor metrics, logs, and other time-series data from multiple sources on a unified platform, making it a critical component of many observability and monitoring setups.
How do I install Grafana?
You can install Grafana by adding its APT repository and using your system’s package manager to deploy and run it as a service, launch it as a Docker container, or use Hostinger’s Grafana VPS template to have it run out of the box.
Can I access Grafana remotely?
Grafana is accessible remotely through a web browser on port 3000 or a configured Domain Name System (DNS) name. If you can’t access it, check if your VPS firewall allows traffic on this port. Since it’s accessible online, consider securing access using authentication, HTTPS, and other recommended best practices.
All of the tutorial content on this website is subject to Hostinger's rigorous editorial standards and values.

Alanas is a Content Writer with a foundation in IT and Operations. His expertise spans cloud engineering, DevOps, and process definition and optimization, gained through his experience in fintech and data-driven organizations of various sizes. Outside of work, he enjoys traveling, exploring history, gaming, and spending quality time with his family. Find him on LinkedIn.

Valentinas Čirba, Hostinger's Head of VPS, is a seasoned product leader specializing in VPS products with over ten years of experience. He's an expert at setting product strategy, leading cross-functional teams, and making smart decisions to deliver innovative solutions. Valentinas is committed to creating products that not only meet business objectives but also truly serve the customer. Follow him on LinkedIn.