How to run a Grafana Docker image?
Jun 19, 2025
/
Dominykas J.
/
8 min Read
Grafana is a leading open-source tool for visualizing time-series data, offering intuitive dashboards and monitoring capabilities. It is widely used to visualize data from various sources like Prometheus, InfluxDB, and Loki. Running Grafana efficiently is crucial for effective data analysis, but setting it up manually can be complex.
The fastest and most flexible way to deploy Grafana is through Docker, which allows you to run Grafana in a containerized environment. This eliminates the need for intricate system configurations or dealing with dependencies.
In this guide, we’ll walk you through the process of running Grafana in Docker. Specifically, you’ll learn how to:
- Pull and run the Grafana Docker image with a simple command.
- Expose Grafana ports to access the web UI.
- Persist your Grafana settings and dashboards across container restarts.
- Configure Grafana using environment variables or a Dockerfile.
- Simplify Grafana deployment using Docker Compose for multi-container orchestration.
By following these steps, you’ll have Grafana running in a Docker container, ready for monitoring and visualization. This article covers everything you need, from the basics to advanced configuration options.
Prerequisites
Before you start, make sure your system meets the following requirements:
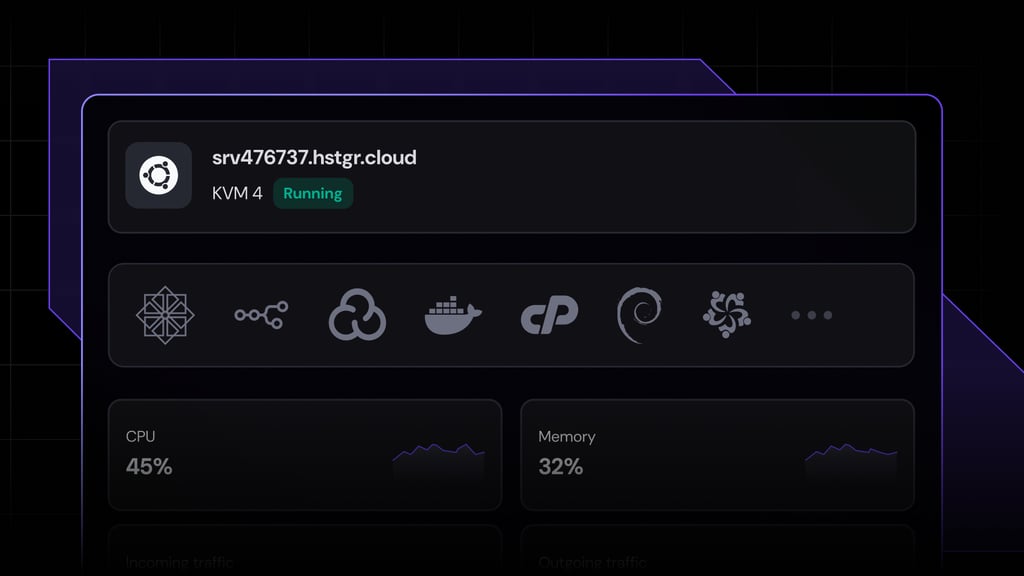
- Docker installed: You need Docker Engine installed and running on your system. If you want to get started quickly, Hostinger offers a one-click Docker installation template with our VPS hosting plans.
- Command-line familiarity: You’ll need to be comfortable using a terminal to run Docker commands. Hostinger offers an easy-to-use browser console, which enables you to run commands directly in the browser window.
- Sudo access: On Linux, you must prefix Docker commands with sudo or add your user to the docker group.
Once these are in place, you’ll be ready to begin.

Pulling the Grafana Docker image
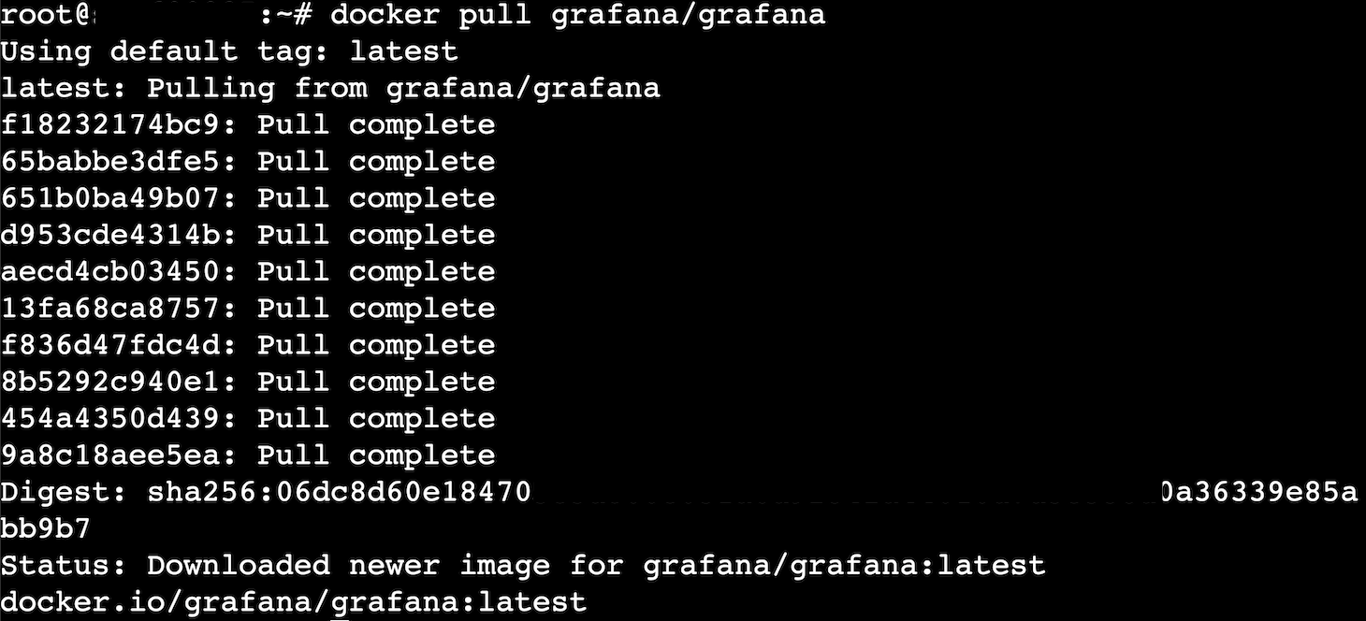
To get started, you need to download the Grafana image from Docker Hub. This image contains everything required to install Grafana and run it in a containerized environment.
Here’s the basic command:
docker pull grafana/grafana
Docker automatically pulls the most recent stable release if you don’t specify a version tag. If you do want a specific version, let’s say 10.3.1, your command should look like this:
docker pull grafana/grafana:10.3.1
All available Grafana version tags can be found on Docker Hub.
Running this will:
- Download the official Grafana Docker image and store it locally on your machine.
- Ensure that Docker can spin up containers using this image by adding the necessary dependencies.
You only need to run docker pull once, unless you want to refresh your image to get the latest updates.
Running the Grafana container
Once the Grafana image is pulled, you can start a Docker container with a single docker run command. This is the fastest way to run Grafana locally or on a server.
Here’s a basic example:
docker run -d -p 3000:3000 --name=grafana grafana/grafana
Let’s break down what this does:
- docker run: Tells Docker to create and start a new container.
- -d: Runs the Docker container in detached mode, so it runs in the background.
- -p 3000:3000: Maps port 3000 on your host to port 3000 in the Docker container, the default port Grafana uses.
- –name=grafana: Gives your Docker container a recognizable name (grafana), so you can refer to it easily in future commands.
- grafana/grafana: Specifies the Docker image to use.

Once the container starts, Grafana will be set up. You can confirm the Grafana Docker container is up by running:
docker ps
In the results, you will see a running Docker container named grafana, similar to this:

This method gets you up and running with Grafana in seconds – no config files, no manual setup. It’s great for quick testing or local development.
Accessing the Grafana dashboard
Once your Grafana container is running, you can access its web interface directly from your browser. Open the browser of your choice and navigate to http://localhost:3000.
Important! If you’re running the Docker container on a remote server, replace localhost with the server’s IP address or domain name.
Once connected, you’ll see a login screen:
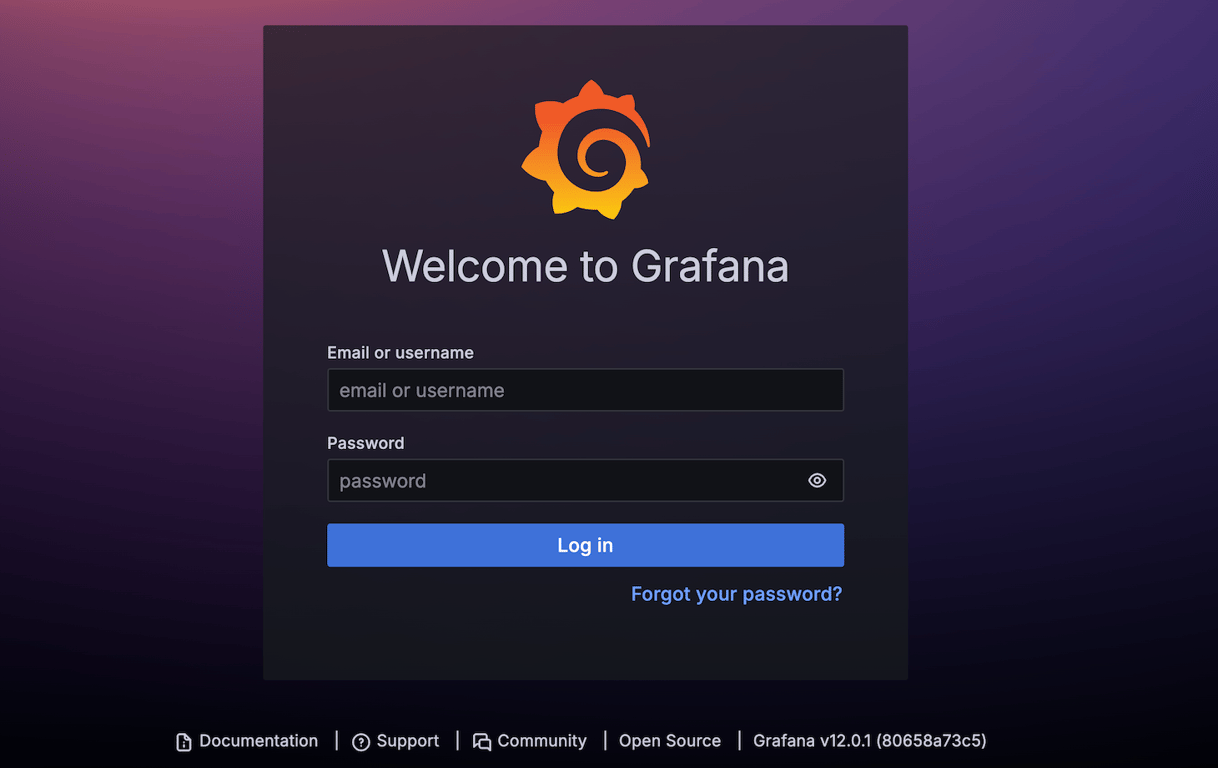
Grafana’s default login credentials are:
- Username – admin
- Password – admin
After logging in, Grafana will prompt you to change the default password:
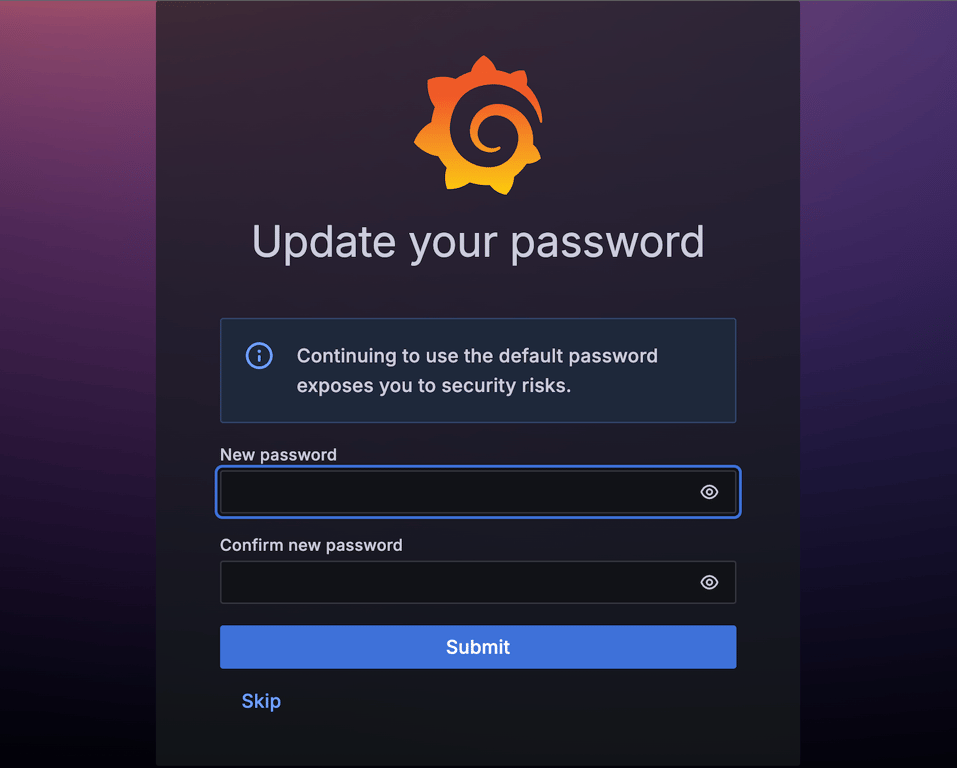
It’s strongly recommended that you do this right away, especially if the Docker container is exposed on a public network or the internet.
Once logged in, you’ll land on the main dashboard interface, which will look something like this:
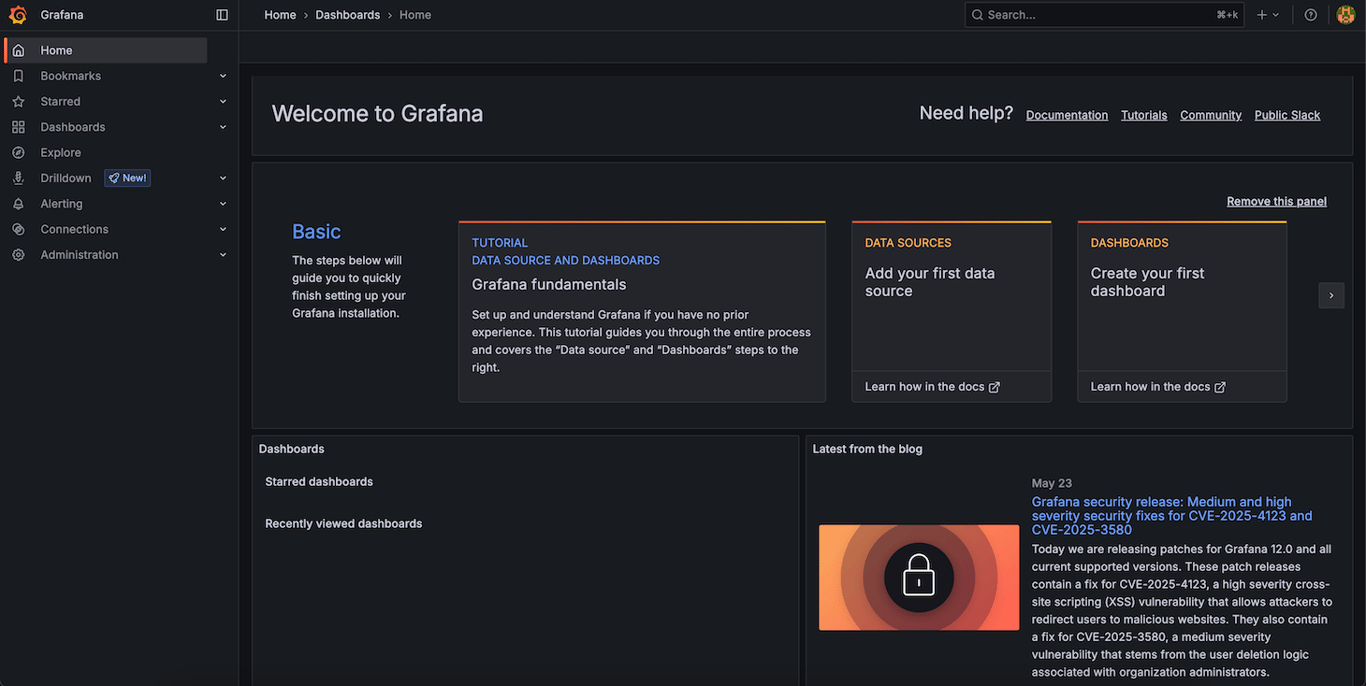
Here you can add data sources, create panels, and build custom dashboards.
Persisting Grafana data
By default, any data you create inside a Docker container will be lost when the container is stopped or removed. This includes plugins, user settings, and Grafana dashboards. While this is fine for quick testing, it’s not viable for long-term use.
To prevent data loss, you need to mount a persistent volume so that Grafana’s data is stored outside the Docker container:
- Create a named Grafana Docker volume with the docker volume command:
docker volume create grafana-storage

This volume will store Grafana’s data directory /var/lib/grafana inside the Docker container.
You can run docker volume ls -f dangling=true to confirm the volume has been created and is not in use by any Docker container:

- Stop and remove the currently running Docker container with these commands:
docker stop grafana
docker rm grafana
- Run a new Grafana Docker container while mounting the volume:
docker run -d \
  -p 3000:3000 \
  --name=grafana \
  --volume grafana-storage:/var/lib/grafana \
  grafana/grafana
- Confirm the volume is mounted with docker inspect:
docker inspect --format '{{json .Mounts}}' grafanaThis will return a list of mounted volumes, where you will see the volume you created listed now:

You can now safely stop, restart, or upgrade the Docker container without losing your setup. Docker will load files from the mounted volume to Grafana’s data directory, and Grafana will load your saved state automatically.
Configuring Grafana with environment variables
Grafana supports many environment variables that let you customize settings during Docker container startup without editing config files. This is especially useful for automation, scripting, or running Grafana in a consistent state across environments.
Here are a few common environment variables you might want to set:
- GF_SECURITY_ADMIN_PASSWORD – Sets the initial admin password.
- GF_SERVER_ROOT_URL – Defines the root URL, useful when Grafana is behind a reverse proxy.
- GF_USERS_ALLOW_SIGN_UP – Enables or disables user sign-ups.
- GF_INSTALL_PLUGINS – Auto-installs plugins at startup, defined in a comma-separated list.
To pass environment variables, use the -e flag in your docker run command:
docker run -d \

  -p 3000:3000 \

  --name=grafana \

  -e GF_SECURITY_ADMIN_PASSWORD=SuperSecurePass \

  -e GF_SERVER_ROOT_URL=http://mygrafana.example.com \

  -e GF_USERS_ALLOW_SIGN_UP=false \

  grafana/grafana
In this example, we:
- Change the default admin password from admin to SuperSecurePass.
- Tell Grafana its root URL is http://mygrafana.example.com when running behind a proxy.
- Disable the sign-up option for new users by setting GF_USERS_ALLOW_SIGN_UP to false.
You can combine this with volume mounting for a fully customized and persistent setup.
Environment variables are applied each time the Docker container starts, making them ideal for version-controlled deployments or Docker Compose configurations.
How to build a custom Grafana Docker image
You may want more than just the base Grafana setup in some cases. For example, you might want to:
- Pre-install specific plugins
- Include custom configuration files
- Apply branding or themes
- Bake in environment-specific settings
Rather than configuring all of this every time a container runs, you can build a custom Grafana Docker image with a custom Dockerfile that includes everything out of the box. Here are step-by-step instructions:
- Create a Dockerfile – it’s a simple text file with instructions for Docker. Here’s an example:
FROM grafana/grafana:latest

# Install one or more plugins
RUN grafana-cli plugins install grafana-clock-panel

# Optional: copy in custom config files
# COPY custom.ini /etc/grafana/grafana.ini
In this example, we start from a default Grafana Docker image and install the Grafana Clock Panel plugin on top. Save it as Dockerfile in a directory of your choice.
- Build the Docker image with the docker build command:
docker build -t my-grafana-custom .
This creates a new image tagged my-grafana-custom.
Important! Replace the . symbol at the end with the path to your Dockerfile if you’re running the command from a different directory.
- Run the custom image to start a Docker container. Use the docker run command:
docker run -d \
  -p 3000:3000 \
  --name=grafana-custom \
  my-grafana-custom
This container behaves like any Grafana instance but comes with your plugins and customizations already installed. You can still attach volumes and pass environment variables as needed.
Custom images are great for teams, CI/CD pipelines, and repeatable deployments, giving you full control over your Grafana instance with minimal setup. Use a custom image if:
- You deploy Grafana frequently and want a consistent, ready-to-go setup
- You’re automating infrastructure and need a plug-and-play solution
- You want to include plugins or configs without manual intervention
Running Grafana with Docker Compose
Managing containers with docker run works fine for single instances. However, as your setup grows, or if you want a cleaner, more repeatable deployment, Docker Compose is the way to go. It lets you define your entire container configuration in a single YAML file and spin everything up with one command.
Why use Docker Compose?
- It simplifies multi-container setups like Grafana and Prometheus.
- It keeps configuration in version control.
- It makes environment replication easy across local and remote machines.
- It requires less typing, especially when using volumes, networks, and environment variables.
Simplifying setup with Docker Compose
Let’s set up Grafana using Docker Compose:
- Create a docker-compose.yml file. Here is an example file:
version: '3.8'
#start a services block
services:
  #start grafana block
  grafana:
    #define the image to use
    image: grafana/grafana:latest
    #name the Docker container
    container_name: grafana
    #map ports
    ports:
      - "3000:3000"
    #define environment variables
    environment:
      - GF_SECURITY_ADMIN_PASSWORD=StrongPassword123
      - GF_USERS_ALLOW_SIGN_UP=false
    #mount a volume
    volumes:
      - grafana-storage:/var/lib/grafana
    restart: unless-stopped

volumes:
  grafana-storage:
Save it in the directory from which you’ll be running your container.
- Run the Grafana container with the docker-compose up command:
docker-compose up -d
- And if you need to stop the container:
docker-compose down
In this example, we:
- Pull the Grafana image if it’s not already local.
- Create and run the Docker container in detached mode with -d flag.
- Automatically recreate the container on reboot, thanks to restart: unless-stopped.
- Store data persistently using the named volume grafana-storage.
Multi-tool setup with Docker Compose
Docker Compose really shines when deploying multiple tools at once. Let’s review an example setup with:
- Prometheus – To collect metrics from configured targets.
- Grafana – To visualize those metrics using dashboards.
- A shared network and persistent storage for both services.
- Create a prometheus.yml file for Prometheus configuration:
global:
  scrape_interval: 15s

scrape_configs:
  - job_name: 'prometheus'
    static_configs:
      - targets: ['localhost:9090']
You can add other exporters later (like node_exporter or cAdvisor) by extending this config.
- Create a docker-compose.yml file for both tools:
version: '3.8'

services:
  prometheus:
    image: prom/prometheus:latest
    container_name: prometheus
    volumes:
      - prometheus-data:/prometheus
      - ./prometheus.yml:/etc/prometheus/prometheus.yml
    ports:
      - "9090:9090"
    restart: unless-stopped

  grafana:
    image: grafana/grafana:latest
    container_name: grafana
    environment:
      - GF_SECURITY_ADMIN_PASSWORD=admin123
    ports:
      - "3000:3000"
    volumes:
      - grafana-data:/var/lib/grafana
    restart: unless-stopped
    depends_on:
      - prometheus

volumes:
  prometheus-data:
  grafana-data:
- Start both containers with Docker Compose:
docker-compose up -d
Make sure you execute this command from the same directory where you saved docker-compose.yml and prometheus.yml files.
You now have Grafana accessible at http://localhost:3000 and Prometheus at http://localhost:9090. The only thing left to do is to add Prometheus as a data source on the Grafana dashboard, and your metric collection will be ready to go!
Using Docker Compose makes your setup more maintainable and production-friendly, especially when you’re ready to expand beyond just Grafana.
Conclusion
Running Grafana in Docker is one of the fastest and most flexible ways to get up and running with powerful dashboards and monitoring.
Here are the key takeaways:
- You can start Grafana instantly using a simple docker run command.
- Persisting data with volumes ensures your dashboards, settings, and plugins aren’t lost between sessions.
- Environment variables let you preconfigure Grafana on launch – great for automation and consistency.
- A custom Docker image allows you to preinstall plugins or embed default settings.
- Docker Compose simplifies multi-container setups and makes your deployments repeatable and easy to manage.
With just a few commands, you can go from zero to a fully functioning Grafana instance. Whether you’re building a monitoring stack, testing data sources, or sharing dashboards with your team, Docker gives you the speed and flexibility to move fast without cutting corners.
Now that you’ve got the fundamentals down, try connecting Grafana to a data source like Prometheus or InfluxDB, explore community plugins, or even automate the whole thing as part of your CI/CD pipeline.
Running a Grafana Docker image FAQ
What is a Grafana Docker image?
Grafana Docker image is a pre-packaged version of Grafana bundled with all necessary dependencies. It’s designed to run inside a Docker container, and lets you deploy Grafana quickly and consistently across environments without manually installing or configuring software on your host machine.
How do I pull the Grafana Docker image?
To pull the Grafana image from Docker Hub, run:docker pull grafana/grafanaThis command downloads the latest stable version of Grafana to your system so it’s ready to use. You can also specify a version tag like grafana/grafana:10.3.1 to pull a specific release.
What are the basic commands to run Grafana in Docker?
The simplest way to run Grafana in Docker is using the docker run command:docker run -d -p 3000:3000 --name=grafana grafana/grafanaThis starts Grafana in detached mode, maps port 3000, and makes the dashboard accessible at http://localhost:3000. Use docker stop grafana to stop the Docker container.
All of the tutorial content on this website is subject to Hostinger's rigorous editorial standards and values.

Dominykas is a Technical Content Writer with a background in cloud engineering and technical support. He’s operated in fields like fintech and point-of-sale and is passionate about software development, DevOps, and AI. Find him on LinkedIn.