How to install Grafana Loki on Ubuntu
Jun 19, 2025
/
Dominykas J.
/
7 min Read
Grafana Loki is a horizontally scalable, open-source log aggregation system designed for efficiency and simplicity. Unlike traditional logging tools that index the full content of logs, Loki indexes only metadata, such as labels. This approach makes Loki more cost-effective and ideal for large-scale systems where performance is critical.
In this guide, you will learn how to:
- Install Grafana Loki on an Ubuntu VPS.
- Configure Loki to efficiently ingest logs from your services.
- Integrate Grafana Loki with Grafana to visualize and query logs seamlessly.
By the end of this tutorial, you will have a fully operational Loki setup integrated with Grafana, ready to collect and display logs from your services.
Prerequisites
Before you begin Loki installation, make sure your environment meets the following requirements:
- Ubuntu 20.04 or later as your VPS operating system.
- Sudo or root access to perform system-level changes.
- Grafana installed on your VPS. Hostinger offers a one-click Grafana installation template with our VPS hosting plans to help you get started quickly.
- Terminal access via SSH or local shell.
- Basic familiarity with Linux commands.
- Basic tools installed:
- wget to download files.
- unzip to extract Loki binaries.
- systemctl to manage systemd services.
With these in place, you’re ready to start installing Loki dependencies.
How to install Grafana Loki?
1. Install dependencies
Before installing Loki, make sure your system is up to date and has the necessary tools to handle downloads and file extraction.
First, ensure your package list and packages are up to date by running:
sudo apt update && sudo apt upgrade -y
- apt update refreshes your package list.
- apt upgrade -y ensures all installed packages are current.
Next, if you haven’t yet, install wget and unzip. Run:
sudo apt install -y wget unzip
Once these are in place, you’re ready to download and install Loki.
2. Download and install Loki
Next, you’ll download the latest Loki binary and set it up for system-wide access.
- Download the latest Loki release from GitHub by running:
wget https://github.com/grafana/loki/releases/download/v3.5.1/loki-linux-amd64.zip
Replace the version number above v3.5.1 with the latest stable release from the official Loki GitHub releases.
- Unzip the archive with unzip:
unzip loki-linux-amd64.zip
- Make the binary executable:
chmod +x loki-linux-amd64
- Move it to a system path:
sudo mv loki-linux-amd64 /usr/local/bin/loki
The /usr/local/bin directory is commonly used for user-installed programs, and makes the loki command accessible from anywhere in the terminal without specifying the full path.
- Confirm Loki is installed:
loki --version
The terminal will return the version of the currently installed Loki, similar to this:
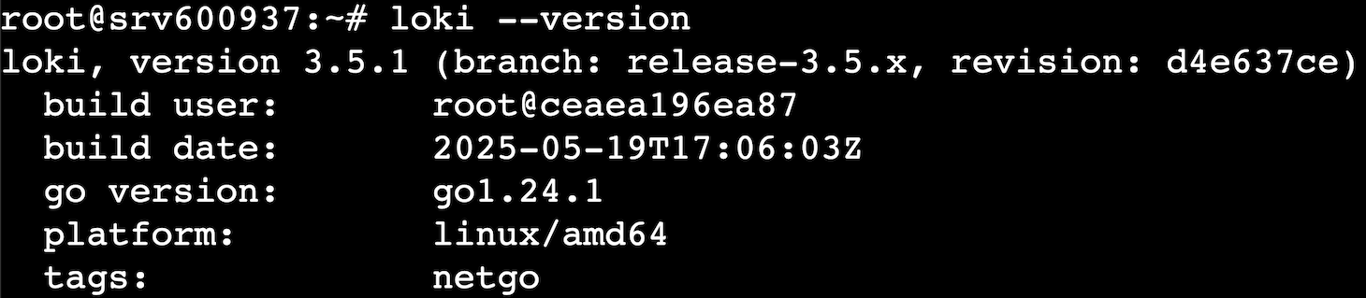
With Loki installed, the next step is setting up its configuration.
3. Configure Loki
Loki relies on a configuration file to define how it runs – everything from network ports to storage paths. Before running the service, you’ll need to set this up properly.
- Create a directory for Loki configuration and move to it:
sudo mkdir -p /etc/loki

cd /etc/loki
- Download the default config file:
sudo wget https://raw.githubusercontent.com/grafana/loki/v3.5.1/cmd/loki/loki-local-config.yaml -O config.yaml
Grafana provides example configuration files. For a basic setup, we’ll start with this local config.
Let’s review the contents of the config.yaml file we downloaded and get familiar with. You can use nano or any other text editor available:
nano config.yaml
Once opened, you’ll see a file similar to this:
auth_enabled: false

server:

  http_listen_port: 3100

  grpc_listen_port: 9096

  log_level: debug

  grpc_server_max_concurrent_streams: 1000

common:

  instance_addr: 127.0.0.1

  path_prefix: /tmp/loki

  storage:

    filesystem:

      chunks_directory: /tmp/loki/chunks

      rules_directory: /tmp/loki/rules

  replication_factor: 1

  ring:

    kvstore:

      store: inmemory

query_range:

  results_cache:

    cache:

      embedded_cache:

        enabled: true

        max_size_mb: 100

limits_config:

  metric_aggregation_enabled: true

schema_config:

  configs:

    - from: 2020-10-24

      store: tsdb

      object_store: filesystem

      schema: v13

      index:

        prefix: index_

        period: 24h

pattern_ingester:

  enabled: true

  metric_aggregation:

    loki_address: localhost:3100

ruler:

  alertmanager_url: http://localhost:9093

frontend:

  encoding: protobuf

querier:

  engine:

    enable_multi_variant_queries: true
- server: Defines the HTTP port and gRPC interfaces Loki listens on.
- common: Defines settings shared across different components like ingesters, queriers, and distributors.
- storage: Tells Loki where to store logs. It can be local or cloud storage, for example.
- schema_config: Sets up how logs are indexed and stored over time.
For a minimal setup, you can use this config instead:
auth_enabled: false

server:

  http_listen_port: 3100

  grpc_listen_port: 9096

ingester:

  lifecycler:

    ring:

      kvstore:

        store: inmemory

      replication_factor: 1

  chunk_idle_period: 5m

  max_chunk_age: 1h

  wal:

    enabled: true

    dir: /var/lib/loki/wal

schema_config:

  configs:

    - from: 2024-01-01

      store: tsdb

      object_store: filesystem

      schema: v13

      index:

        prefix: index_

        period: 24h

storage_config:

  tsdb_shipper:

    active_index_directory: /var/lib/loki/index

    cache_location: /var/lib/loki/cache

  filesystem:

    directory: /var/lib/loki/chunks

compactor:

  working_directory: /var/lib/loki/compactor

  compaction_interval: 10m

  retention_enabled: false

limits_config:

  allow_structured_metadata: false

ruler:

  storage:

    type: local

    local:

      directory: /tmp/rules

  rule_path: /tmp/rules-temp

  enable_api: true
This configuration uses local storage, which is ideal for small-scale VPS deployments. You can expand it later to use S3, GCS, or other backends for production use.
Important! The provided configuration is valid for Loki v3.5.1. However, the requirements are constantly changing and may differ when you follow this guide.
The provided configuration is valid for Loki v3.5.1. However, the requirements are constantly changing and may differ when you follow this guide.
Next, we’ll set up Loki to run as a systemd service.
4. Run Loki as a systemd service
To keep Loki running in the background and automatically start it on boot, we’ll set it up as a systemd service.
- Create a new service unit file at /etc/systemd/system/loki.service:
sudo nano /etc/systemd/system/loki.service
Paste in the following contents:
[Unit]

Description=Grafana Loki Log Aggregation System

After=network.target

[Service]

Type=simple

ExecStart=/usr/local/bin/loki -config.file=/etc/loki/config.yaml

Restart=on-failure

User=root

[Install]

WantedBy=multi-user.target
Press CTRL + X to close, Y to save changes when prompted, and then ENTER to confirm.
Pro tip
This unit file defines root as the user for Loki. Consider creating a dedicated user in production environments instead.
- Reload systemd and start the Loki service:
sudo systemctl daemon-reexec

sudo systemctl daemon-reload

sudo systemctl start loki

sudo systemctl enable loki
- daemon-reexec ensures changes take immediate effect on some systems.
- daemon-reload reloads unit files.
- enable makes sure Loki starts on boot.
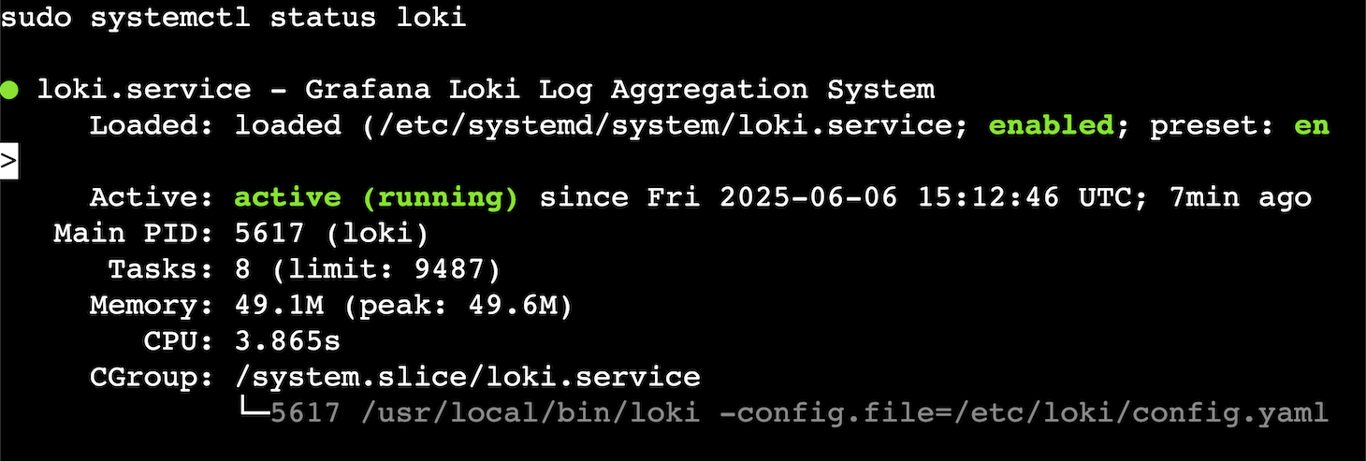
- Confirm the Loki service is running:
sudo systemctl status loki
If the service is running, you will see output similar to this:
- If you’re having issues, you can check Loki’s logs:
journalctl -u loki -f
If everything was successful, you should see logs indicating Loki has started and is listening on port 3100.
With Loki running as a service, it’s time to connect it to Grafana.
5. Integrate Loki with Grafana
We’ll connect Loki to Grafana through Grafana’s dashboard:
- Access Grafana in your browser by navigating to:
http://<your-server-ip>:3000
Replace <your-server-ip> with your actual VPS IP address or domain name.
- Log in to Grafana. The default credentials are:
- Username: admin
- Password: admin
Grafana will prompt you to change the password after the first login, so make sure you choose secure credentials.
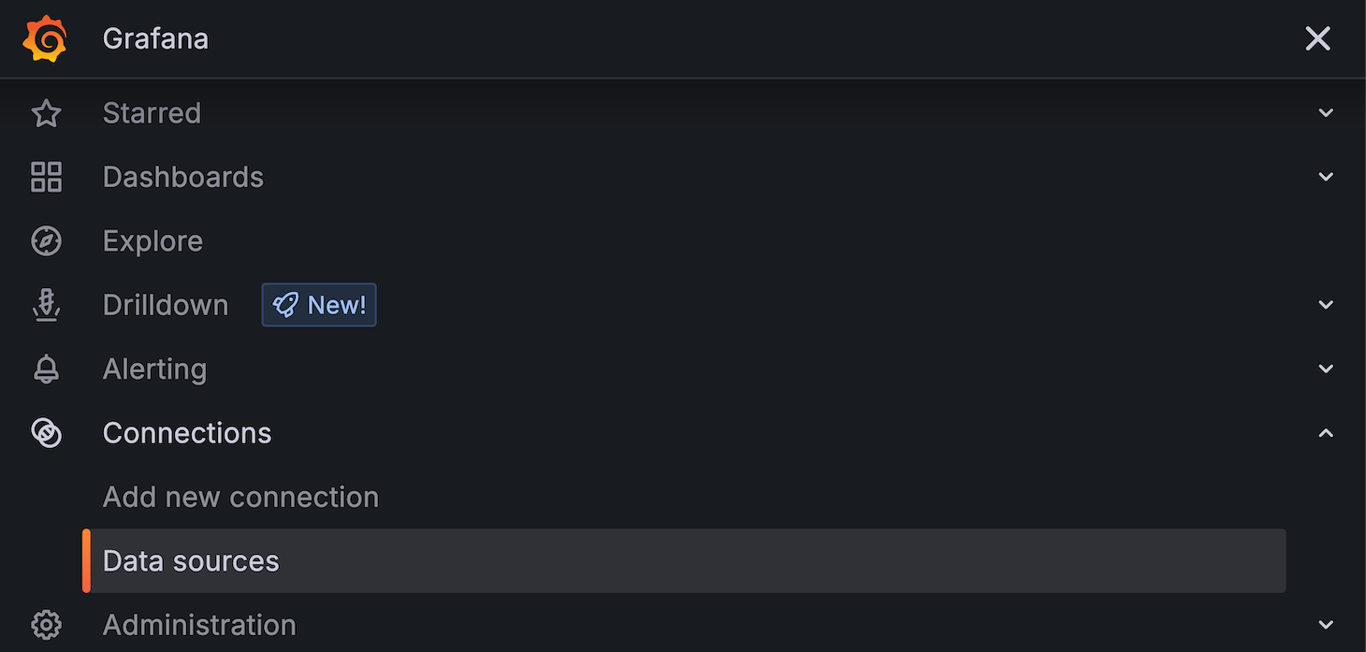
- In the left-hand menu, go to Connections → Data sources:
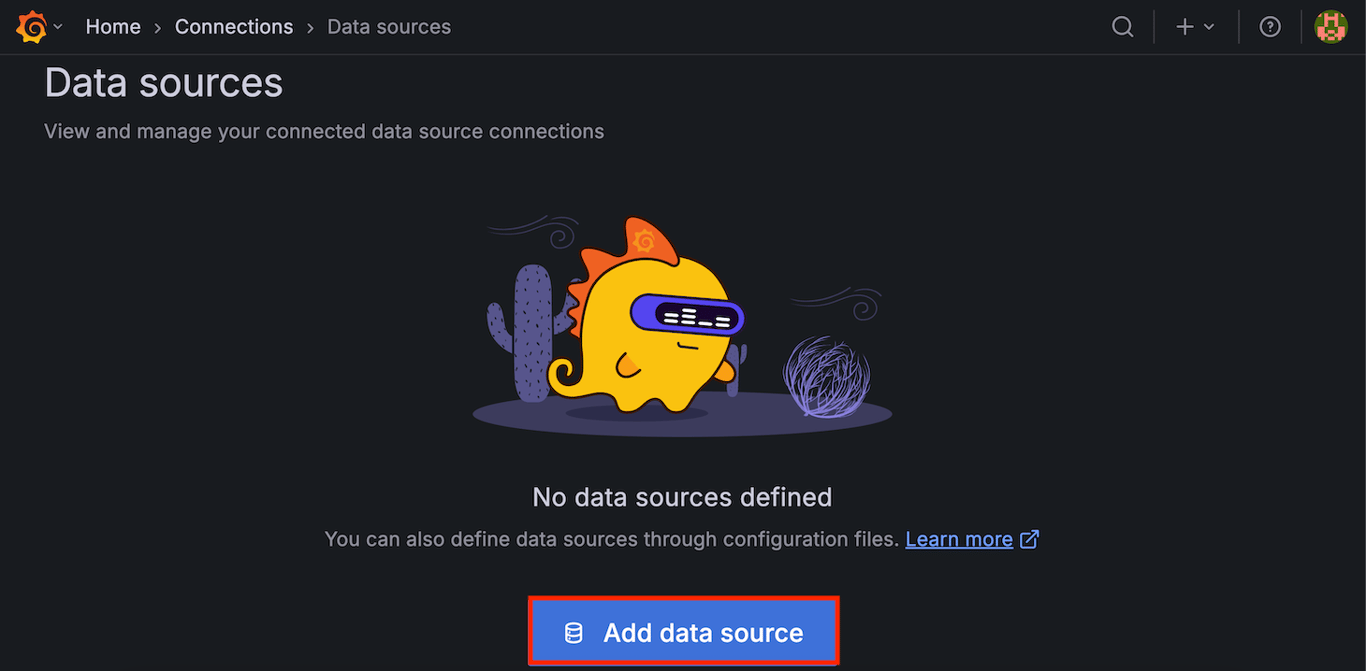
- Click Add data source:
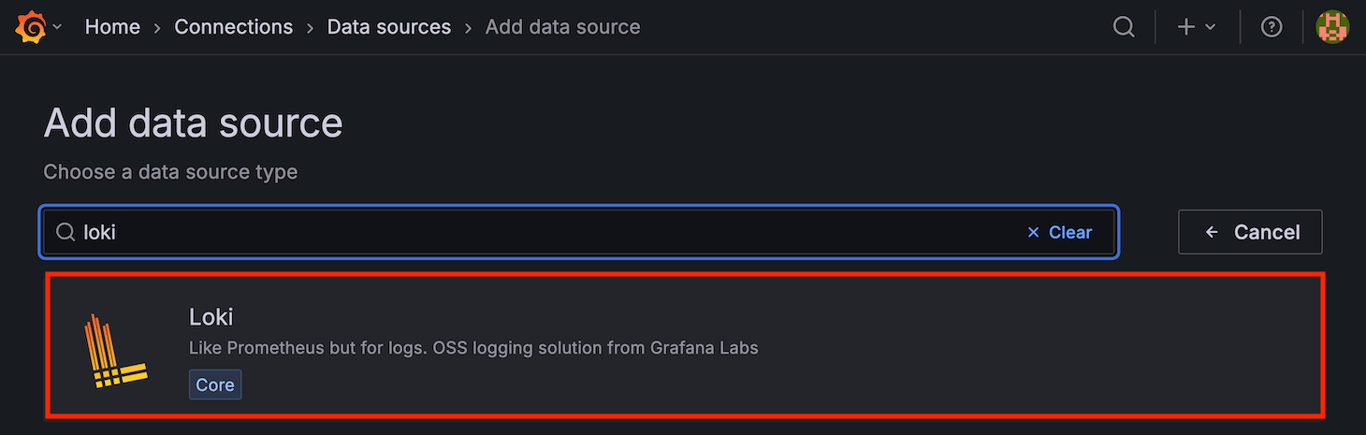
- Search for Loki and choose it from the list of available options:
- In the URL field, enter:
http://localhost:3100
If Loki is running on a different server, use its IP address instead of localhost.
- Click Save & test:
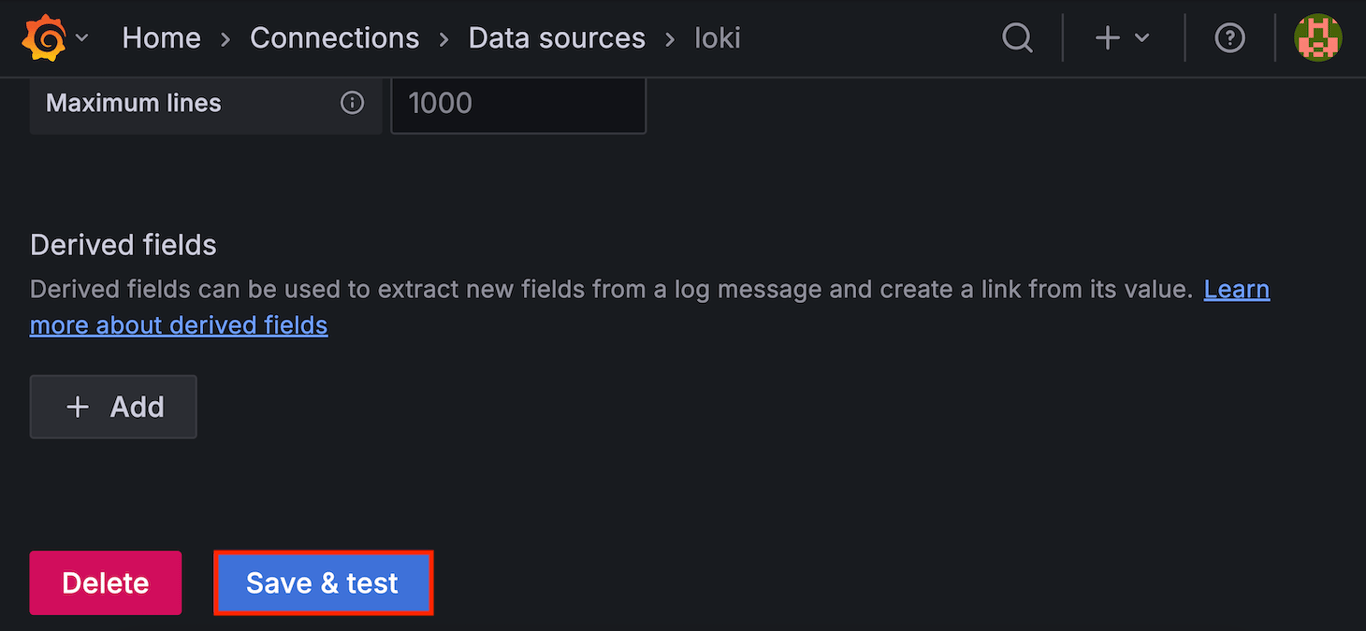
Grafana will connect to Loki and confirm whether it’s working. If successful, you will see a banner similar to this:
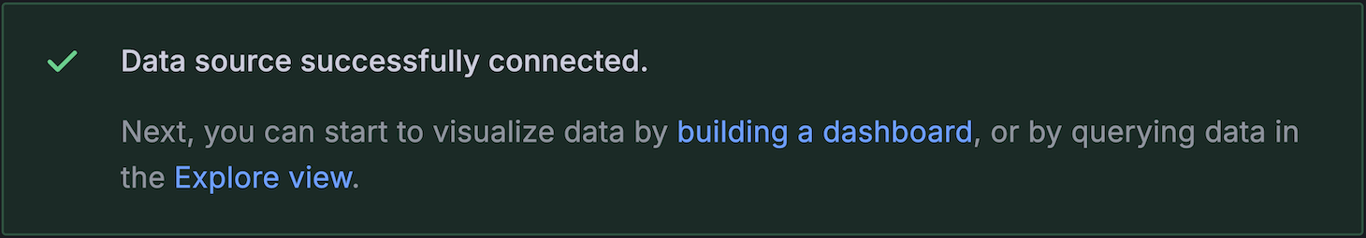
You are now ready to start building dashboards and querying logs.
Next, we’ll install Promtail to start collecting system logs and sending them to Loki.
6. Install Promtail
Promtail is Grafana Loki’s official log shipper. It reads logs from files on your system, like /var/log/syslog, attaches labels, and forwards them to Loki for storage and querying. It works much like a lightweight logstash or fluentd, but it’s designed to integrate directly with Loki.
Let’s set up Promtail to gather and ship syslog to Loki:
- Download and install Promtail:
wget https://github.com/grafana/loki/releases/download/v3.5.1/promtail-linux-amd64.zip

unzip promtail-linux-amd64.zip

chmod +x promtail-linux-amd64

sudo mv promtail-linux-amd64 /usr/local/bin/promtail
- Create a directory for Promtail’s config and move to it:
sudo mkdir -p /etc/promtail

cd /etc/promtail
- Download a sample Promtail config and save it as config.yaml:
sudo wget https://raw.githubusercontent.com/grafana/loki/v3.5.1/clients/cmd/promtail/promtail-local-config.yaml -O config.yaml
- You can instead create your own config for Promtail. Create and open a config.yaml file:
nano config.yaml
Write your config inside the file. You can use this minimal configuration:
server:
  http_listen_port: 9080
  grpc_listen_port: 0

positions:
  filename: /tmp/positions.yaml

clients:
  - url: http://localhost:3100/loki/api/v1/push

scrape_configs:
  - job_name: system
    static_configs:
      - targets:
          - localhost
        labels:
          job: syslog
          __path__: /var/log/syslog
Press CTRL + X to close, Y to save changes when prompted, and then ENTER to confirm.
- Create and open a service unit file for Promtail:
sudo nano /etc/systemd/system/promtail.service
- Paste the following config:
[Unit]

Description=Promtail log shipper for Grafana Loki

After=network.target

[Service]

Type=simple

ExecStart=/usr/local/bin/promtail -config.file=/etc/promtail/config.yaml

Restart=on-failure

[Install]

WantedBy=multi-user.target
Press CTRL + X to close, Y to save changes when prompted, and then ENTER to confirm.
- Reload systemd and start the Promtail service:
sudo systemctl daemon-reload

sudo systemctl start promtail

sudo systemctl enable promtail
- Check the status of the Promtail service:
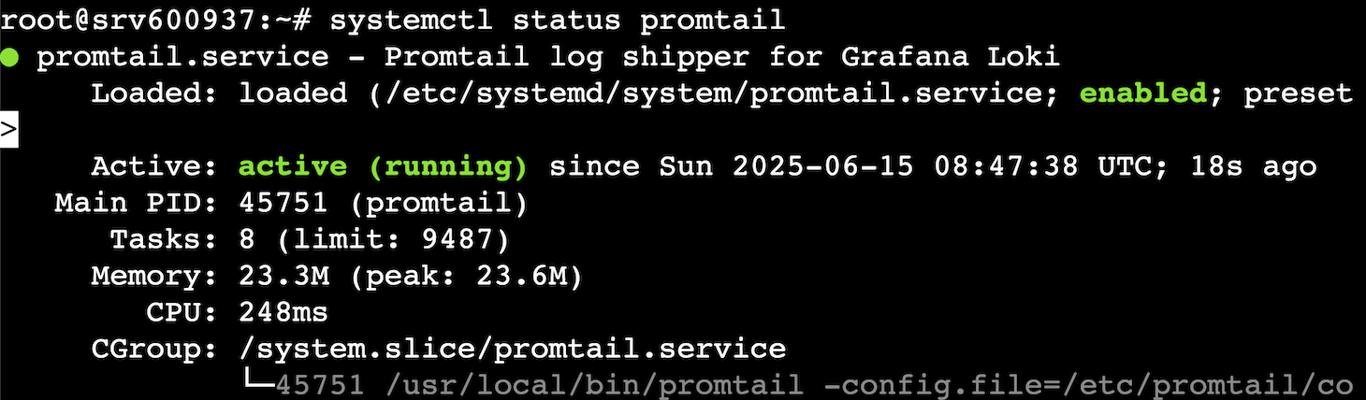
sudo systemctl status promtail
If everything starts up right, you’ll see an output indicating that the service is active, similar to this:
If the status is not active, you can check Promtail service logs and troubleshoot further:
journalctl -u promtail -f
When running, Promtail will begin forwarding logs to Loki, which you can now visualize and query inside Grafana.
7. Verify the installation
Now that Loki and Promtail are up and running and Grafana is connected, it’s time to verify that everything is working and logs are flowing correctly.
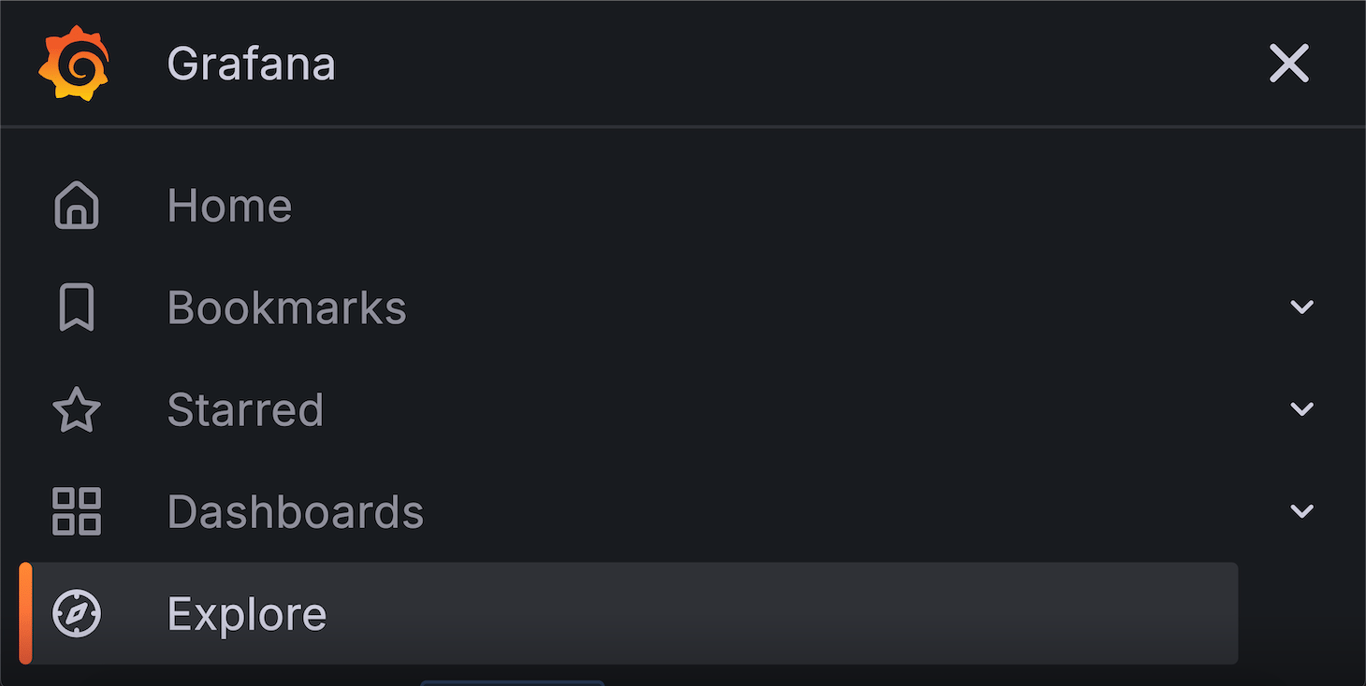
- Open the Grafana web interface and navigate to the Explore section in the left-hand menu:
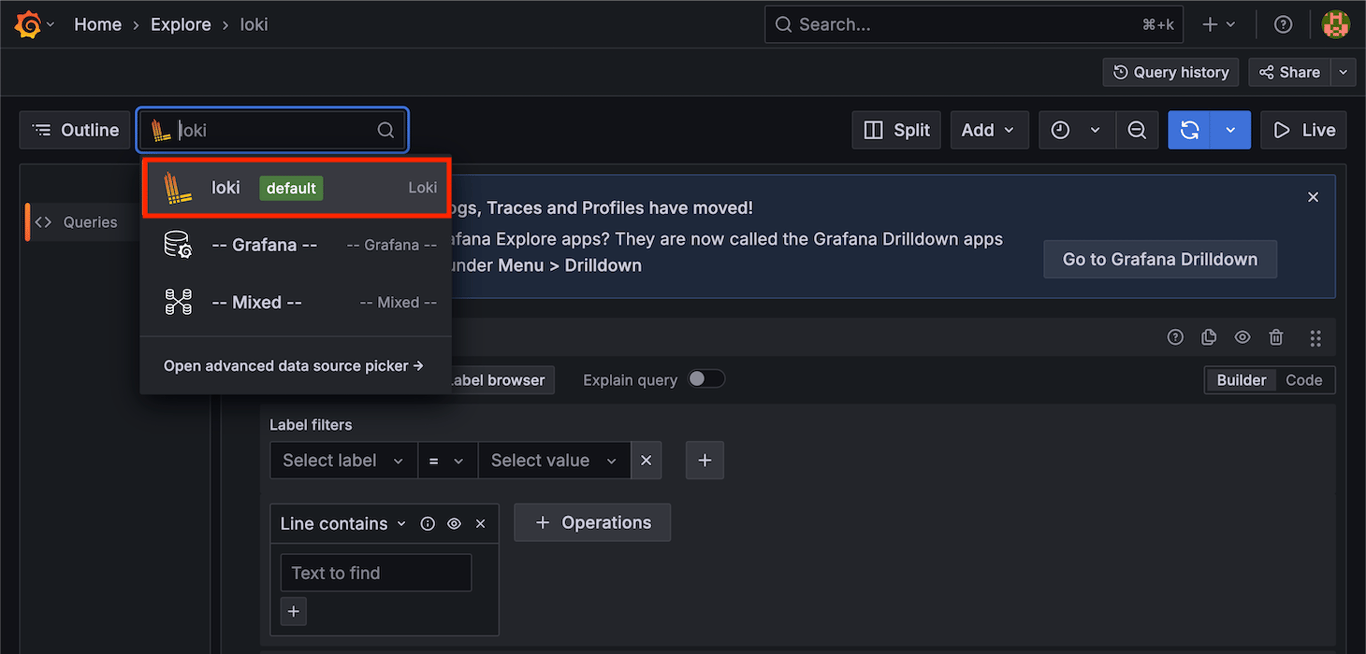
- In the top left of the panel, select Loki as the data source from the dropdown:
- Select Code in the top right of the query editor to use LogQL expressions:
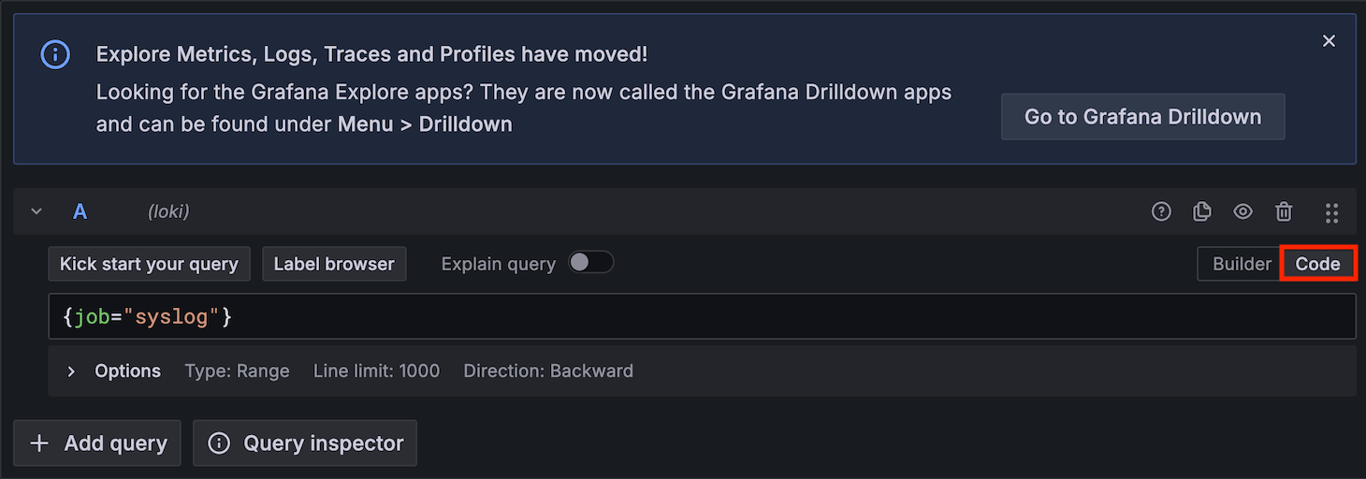
- If you used the sample Promtail config that tails /var/log/syslog, in the query field enter:
{job="syslog"}
Pro tip
If you want to query logs containing “error”, you can use this query instead:
{job="syslog"} |= "error"
LogQL is a powerful querying language, and learning how to efficiently query your logs will help you troubleshoot effectively. You can learn more in the official LogQL documentation.
- Press the Run query button at the top right:
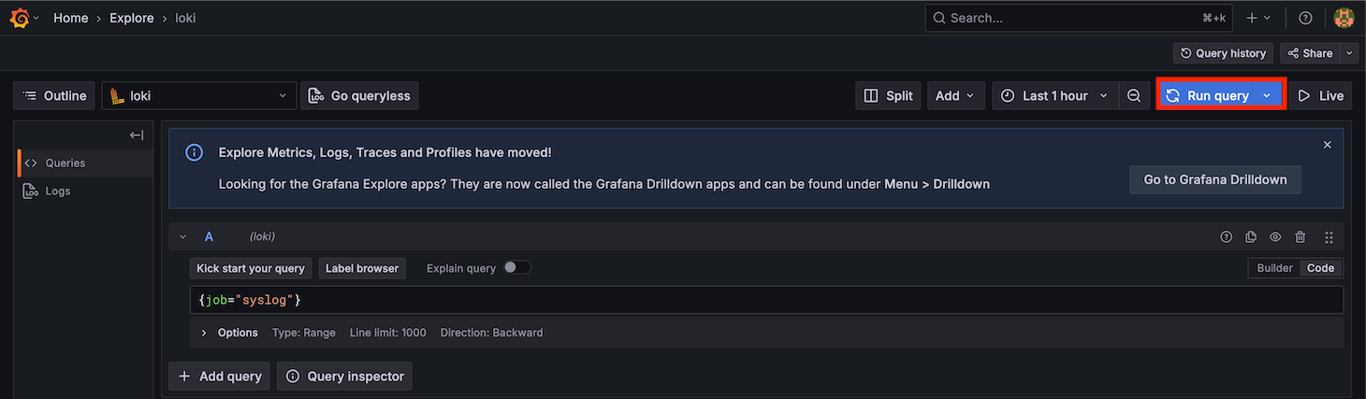
If everything is set up correctly, you should see real-time log entries appear in the panel, each entry with a timestamp, labels, and log message:
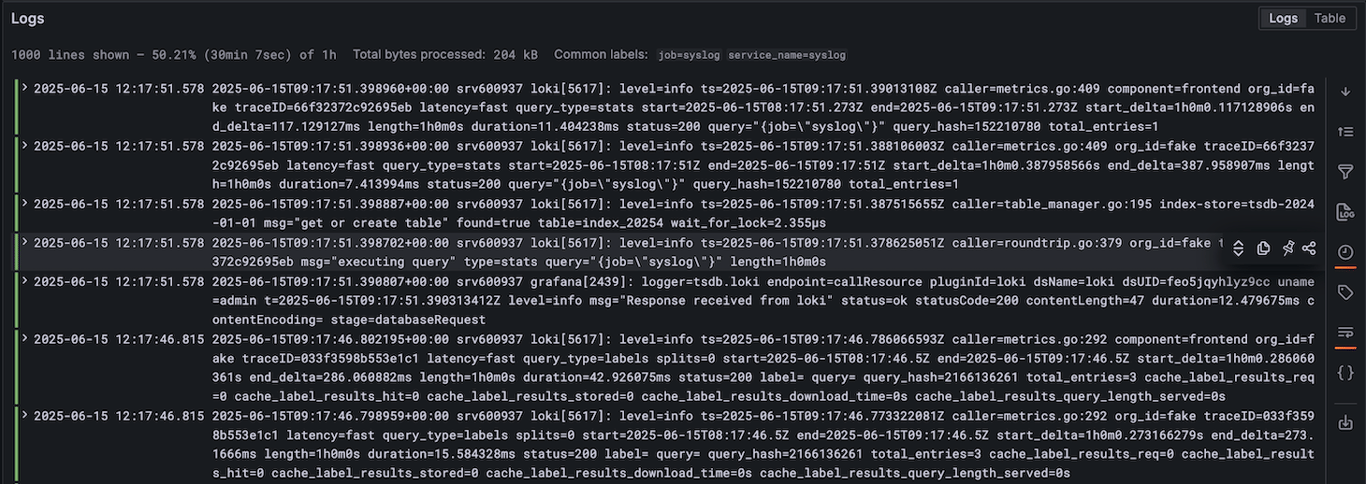
These are being streamed from your VPSs’/var/log/syslog file through Promtail into Loki, and are now viewed in Grafana.
If no logs appear:
- Check Promtail logs for errors or issues:
journalctl -u promtail -f
- Check Loki logs to confirm it’s receiving data:
journalctl -u loki -f
- Ensure Promtail is targeting the correct log file and the path in the config exists:
sudo nano /etc/promtail/config.yaml
With logs visible in Explore, your Loki stack is live and ready for centralized logging and full-text search across your system.
Conclusion
By following this guide, you’ve set up a full Grafana Loki stack on your Ubuntu VPS. You have also installed Loki and Promtail and integrated everything with Grafana for live log monitoring.
You now have centralized logging on your VPS – perfect for debugging, monitoring, and maintaining your infrastructure.
With this setup, you’ll no longer dig through individual log files manually. Instead, you have a unified log interface, searchable by labels and timestamps, all from a clean Grafana dashboard.
Want to take it a step further? Add more log sources by configuring Promtail on other servers, build custom dashboards for application logs and alerting, or explore LogQL to create more advanced queries and filters.
How to install Loki FAQ
What is Loki?
Loki is an open-source log system by Grafana Labs that indexes metadata only, making it faster and cheaper than traditional log tools. It works especially well with Prometheus for monitoring.
What is Grafana Loki used for?
Grafana Loki enables centralized log monitoring and visualization. It lets developers collect, store, and query logs using LogQL in Grafana—ideal for troubleshooting, performance tracking, and understanding app behavior.
Can I use Loki without Promtail?
Yes, you can use Loki without Promtail. While Promtail is the default log shipper for Loki, other agents such as Fluent Bit, Logstash, or custom scripts can also send logs to Loki via its HTTP API. This flexibility lets you integrate Loki into existing logging setups.
All of the tutorial content on this website is subject to Hostinger's rigorous editorial standards and values.

Dominykas is a Technical Content Writer with a background in cloud engineering and technical support. He’s operated in fields like fintech and point-of-sale and is passionate about software development, DevOps, and AI. Find him on LinkedIn.