How to install Grafana Tempo for distributed tracing
Jun 18, 2026
/
Viktoras D. & Valentinas C.
/
6 min Read
Grafana Tempo is an open-source distributed tracing back end from Grafana Labs. In other words, it tracks – or “traces” – requests through every stage in an application. It collects, stores, and analyzes this trace data instrumented with tools like OpenTelemetry or Jaeger. Unlike other back ends, Tempo avoids external databases by writing directly to object storage, making it simpler to operate at scale.
This guide will walk you through installing Tempo on a Linux server, configuring it in single binary mode, integrating it with Grafana, sending test traces, and viewing them through Grafana’s User Interface (UI). By the end, you’ll have a basic Tempo tracing setup ready for debugging and performance monitoring.
Prerequisites
Before you begin the Grafana Tempo installation, make sure your environment meets the following requirements:
- Ubuntu 20.04 or later as your VPS operating system. Hostinger offers a single-click Ubuntu template with its VPS hosting plans.
- Sudo or root access to perform system-level changes.
- Grafana installed on your VPS.
- Terminal access via SSH or local shell.
- Basic familiarity with Linux commands.
- Ensure these basic tools are installed:
- wget to download files.
- tar or unzip to extract Tempo binaries.
- Tracing clients like OpenTelemetry Collector or Jaeger to send traces to Tempo (this is optional).
With the above in place, you’re ready to start installing Tempo.

1. Download and install Tempo
Grafana Tempo supports two common installation methods: running as a single binary or using a Docker container. The binary method is best for local testing, while Docker is often used in production environments.
To install Tempo using the binary:
- Download the Tempo 2.8.1 binary for Linux:
wget https://github.com/grafana/tempo/releases/download/v2.8.1/tempo_2.8.1_linux_amd64.tar.gz
- Extract the archive:
tar -xvf tempo_2.8.1_linux_amd64.tar.gz
This will extract the following files:
- tempo – the main Tempo server binary
- tempo-cli – a command-line tool for interacting with Tempo
- tempo-query – a lightweight UI for querying traces directly
- Make binaries executable and move them to your system path:
chmod +x tempo tempo-cli tempo-query
sudo mv tempo tempo-cli tempo-query /usr/local/bin/
The /usr/local/bin directory is commonly used for user-installed programs, and makes the tempo commands accessible from anywhere in the terminal without specifying the full path.
- Verify the checksum for integrity (optional):
echo "3ae537720814c7c5bea9e7ff82c373b62c44eea1271e1d0ac34d92922f53b223 tempo_2.8.1_linux_amd64.tar.gz" | sha256sum --check
Alternatively, you can install Tempo using Docker:
docker run --rm -p 3200:3200 grafana/tempo:2.8.1
This command runs the Tempo server with default settings and exposes port 3200 for trace ingestion and querying. For production use, mount a custom configuration file and connect external storage.
Tempo is now installed and ready to be configured.
2. Configure Tempo
Tempo relies on a configuration file to define how it runs. This includes trace receivers, local storage paths, and server settings. Before running the service, you must create and customize this file.
Create a directory for the Tempo configuration:
sudo mkdir -p /etc/tempo
cd /etc/tempo
Now, create a new configuration file:
sudo nano tempo.yaml
Paste in the following minimal configuration:
server:
  http_listen_port: 3200

distributor:
  receivers:
    otlp:
      protocols:
        grpc:
        http:
    jaeger:
      protocols:
        thrift_http:
        grpc:

ingester:
  trace_idle_period: 10s
  max_block_duration: 5m

compactor:
  compaction:
    block_retention: 1h

storage:
  trace:
    backend: local
    local:
      path: /tmp/tempo/traces
    wal:
      path: /tmp/tempo/wal
Here’s what each key section of the config means:
- server – sets the HTTP listening port for Tempo’s main interface
- distributor.receivers – defines supported tracing protocols, like OpenTelemetry (OTLP) and Jaeger.
- ingester – handles trace batching and flushing behavior
- compactor – controls how long trace blocks are retained before cleanup
- storage.trace – stores trace data locally for testing, with a local WAL path required
This configuration is designed for quick testing in single binary mode. For production deployments, you’ll need to configure external object storage and fine-tune each service component.
Next, you’ll start the Tempo service and verify that it works.
3. Run Tempo as a systemd service
To keep Tempo running in the background and automatically restart it on boot or failure, you can set it up as a systemd service.
- Create a new service unit file at /etc/systemd/system/tempo.service:
sudo nano /etc/systemd/system/tempo.service
- Paste the following configuration:
[Unit]
Description=Grafana Tempo
After=network.target

[Service]
User=root
ExecStart=/usr/local/bin/tempo -config.file=/etc/tempo/tempo.yaml
Restart=on-failure

[Install]
WantedBy=multi-user.target
- Reload systemd to recognize the new service:
sudo systemctl daemon-reexec
sudo systemctl daemon-reload
- daemon-reexec – ensures changes take immediate effect on some systems.
- daemon-reload – reloads unit files.
- Enable and start Tempo:
sudo systemctl enable tempo
sudo systemctl start tempo
- enable – makes sure Tempo starts on boot.
- start – immediately starts Tempo.
- Check if Tempo is running and view logs:
sudo systemctl status tempo
journalctl -u tempo -f
Tempo now runs as a background service and will start automatically after reboots or failures.
4. Integrate Tempo with Grafana
Once Tempo is running, you can connect it to Grafana to enable trace visualization.
- Access Grafana in your browser by navigating to:
http://<your-server-ip>:3000
Replace <your-server-ip> with your actual VPS IP address or domain name.
- Log in to Grafana. The default credentials are:
- Username: admin
- Password: admin
Grafana will prompt you to change the password after the first login, so ensure you choose secure credentials.
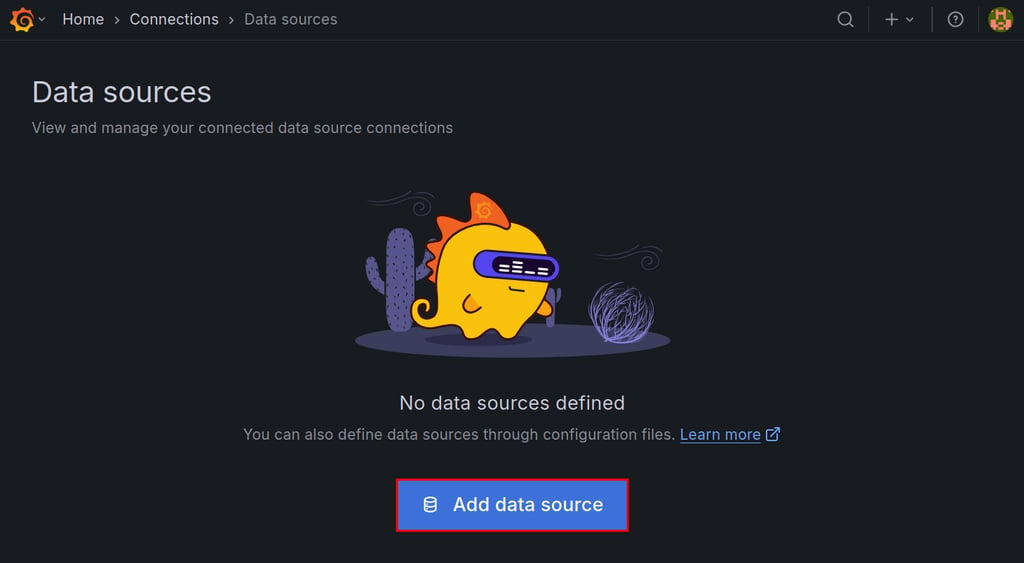
- In the left-hand menu, go to Connections > Data sources.
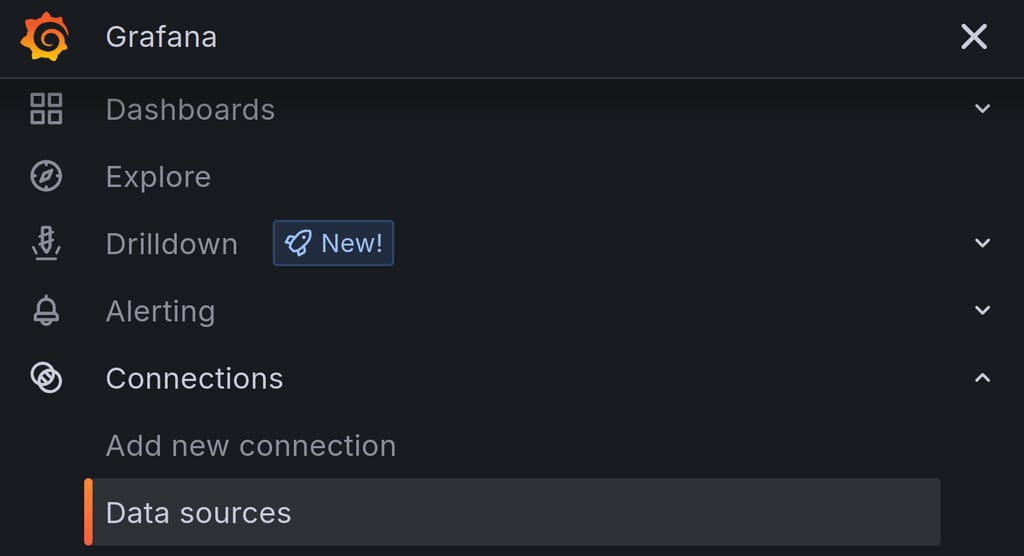
- Click Add data source.
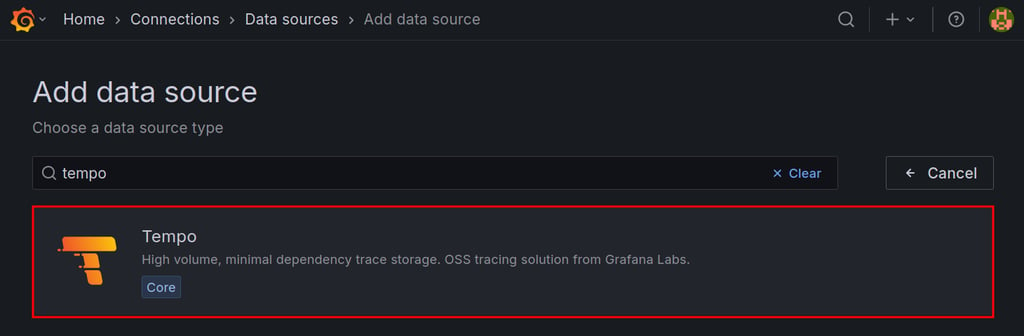
- Search for Tempo and choose it from the list of available options.
- Set the URL to your Tempo server, for example:
http://localhost:3200
If Tempo is running on a different server, use its IP address instead of localhost
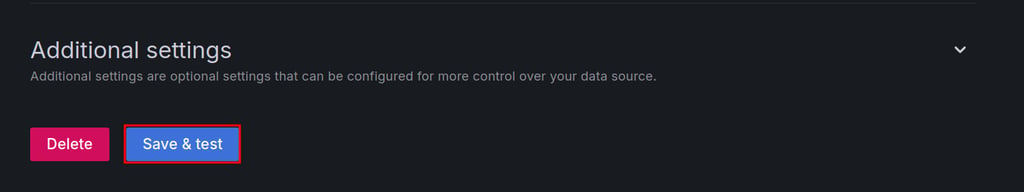
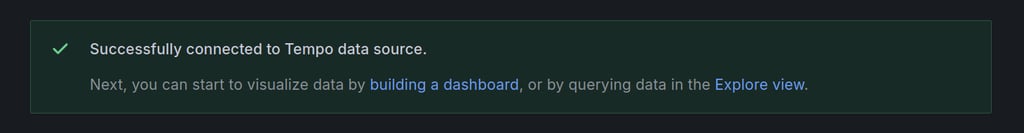
- Click Save & Test to verify the connection
Grafana will connect to Tempo to confirm whether it’s working. If successful, you will see a banner similar to this:
Once the connection is established, you can start exploring trace data. Tempo integrates with Explore in Grafana, especially when paired with logs from Loki or metrics from Prometheus. This allows you to correlate traces with log lines and performance data in one interface.
5. Send test traces to Tempo
To make sure Tempo is receiving data correctly, it’s highly recommended to send some test traces. You can use tools like the OpenTelemetry Collector or the Jaeger client CLI.
You can quickly generate test traffic using Docker and the Jaeger HotROD demo app:
docker run --rm \
  --network=host \
  -e OTEL_EXPORTER_OTLP_ENDPOINT=http://localhost:4318 \
  jaegertracing/example-hotrod:latest \
  all
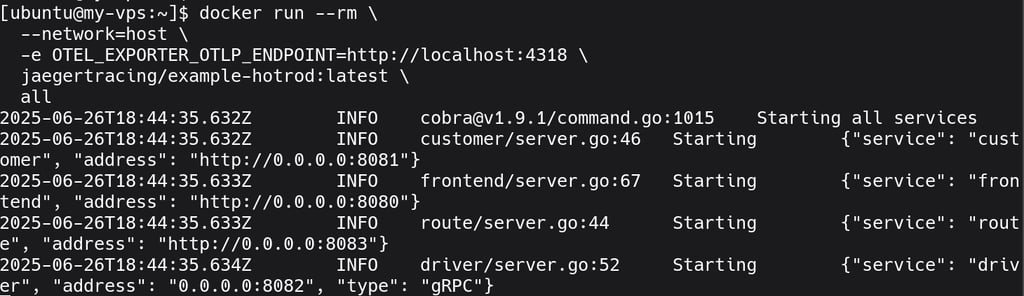
This container starts multiple services such as frontend, driver, route, and customer. However, it won’t emit traces until a request is made.
To trigger trace generation, run:
curl http://localhost:8080
This request simulates a user interaction with the HotROD front end and generates distributed traces that are sent to Tempo.
To send OTLP traces without setting up a full collector, you can use the otel-cli tool:
docker run --rm \
  --network=host ghcr.io/equinix-labs/otel-cli \
  --endpoint http://localhost:4318 \
  span \
  --name "otel-span" \
  --service "otel-service"
This sends a single span to Tempo using the OTLP HTTP protocol, which matches the default configuration in most local setups.
6. Verify the installation
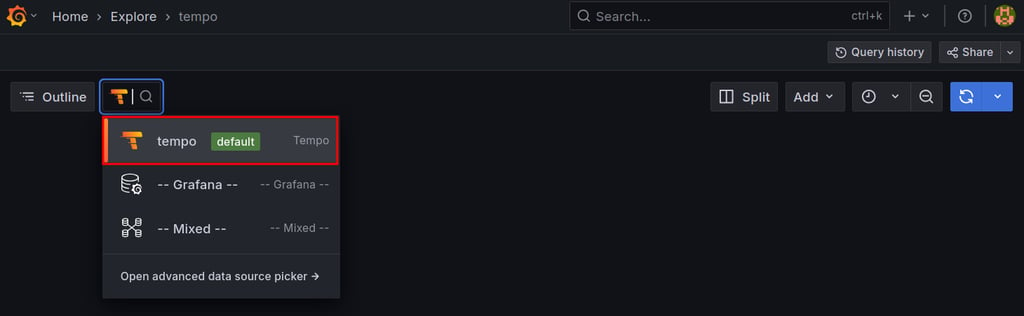
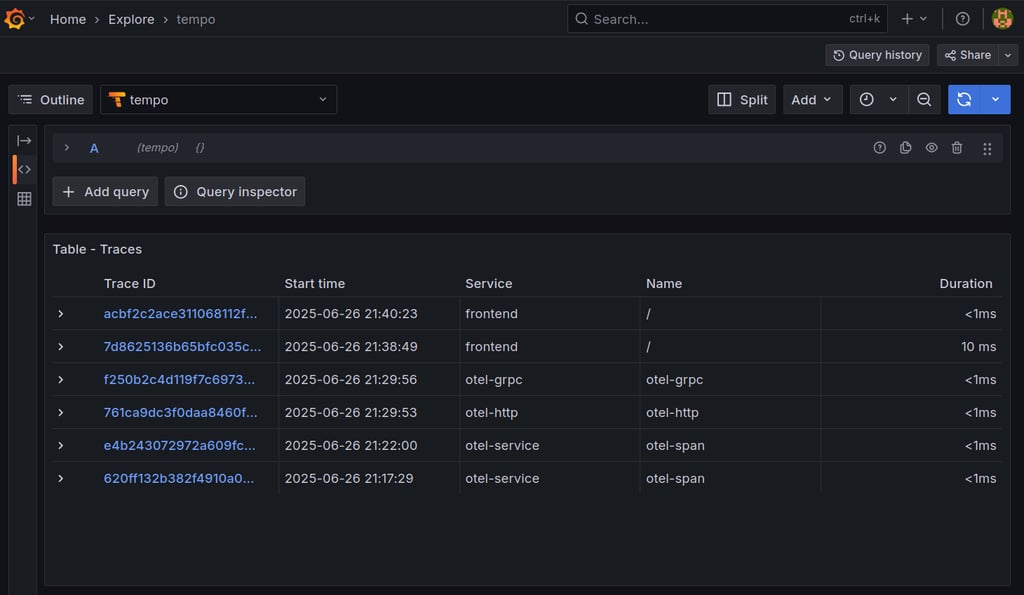
To confirm that everything is working, open Grafana and go to Explore on the left-hand menu.
In the Explore panel:
- Select Tempo as the data source from the dropdown
- If traces have been sent successfully, you’ll see recent trace data appear. You can search by trace ID, view a list of traces, or click into one to see detailed information.
- Trace ID – a unique identifier for the request
- Spans – operations or components involved in the trace
- Timeline – visualizes the duration and order of spans
If no data appears:
- Make sure your trace sender (Jaeger, otel-cli, etc.) has successfully pushed data
- Verify that the correct receiver (e.g., OTLP or Jaeger) is enabled in tempo.yaml
- Ensure ports like 4318, 4317, or 14268 are open and not blocked by a firewall
- 4317: Default port for OTLP over gRPC. Used by OpenTelemetry SDKs and collectors.
- 4318: Default port for OTLP over HTTP. Used by tools like otel-cli.
- 14268: Default port for Jaeger collector’s HTTP endpoint. Used by clients like Jaeger HotROD.
- Check Tempo logs for errors using:
journalctl -u tempo -f
Once you see trace data in Grafana, your Tempo installation and integration are confirmed.
Conclusion
Grafana Tempo makes distributed tracing more accessible by removing the complexity of external databases and integrating smoothly with Grafana. Whether you’re troubleshooting latency issues or tracking down errors across microservices, Tempo helps you get the visibility you need.
This tutorial demonstrated how to install Tempo on an Ubuntu VPS using either the official binary or Docker, configure it to receive traces using OTLP and Jaeger protocols, and set it up as a systemd service for persistent background operation. Tempo was integrated with Grafana for trace visualization and setup was verified by sending test traces using real-world tools like otel-cli and the Jaeger HotROD demo.
With your Tempo tracing setup complete, you’re ready to build a stronger observability stack. For even deeper insights, consider pairing Tempo with Loki for logs and Mimir for metrics.
How to install Grafana Tempo FAQ
What is Tempo?
Grafana Tempo is an open-source tool that collects and stores trace data from applications to help developers monitor and debug system performance. Tempo is designed to be highly scalable and integrates easily with Grafana for trace visualization and analysis.
What is Grafana Tempo used for?
Grafana Tempo is used to collect, store, and query distributed traces from applications. It helps developers understand how requests move through services, identify bottlenecks, and diagnose issues. Tempo supports popular tracing protocols like OTLP and Jaeger and works seamlessly with Grafana’s dashboards and Explore view.
Is Grafana Tempo free to use?
Yes, Grafana Tempo is completely free and open source. You can download, install, and run it without any licensing fees. It’s maintained by Grafana Labs and supported by an active community. Paid options are available through Grafana Cloud, but self-hosted Tempo is fully functional at no cost.
All of the tutorial content on this website is subject to Hostinger's rigorous editorial standards and values.

Viktoras is a Content Writer with a background in DevOps, cloud infrastructure, and automation. With experience in infrastructure management, CI/CD, and API integrations, he focuses on optimizing developer productivity and system reliability. Find him on LinkedIn.

Valentinas Čirba, Hostinger's Head of VPS, is a seasoned product leader specializing in VPS products with over ten years of experience. He's an expert at setting product strategy, leading cross-functional teams, and making smart decisions to deliver innovative solutions. Valentinas is committed to creating products that not only meet business objectives but also truly serve the customer. Follow him on LinkedIn.