Google Analytics 4 tutorial: getting started and understanding how to use it
Google Analytics 4 (GA4) is Google’s latest web analytics measurement tool that replaced Universal Analytics on July 1, 2023.
Google Analytics 4 provides advanced tracking and reporting features using the machine learning model. As a result, website owners can analyze their site performance across different platforms more accurately.
For existing Universal Analytics users, early migration is important to establish your current data structure and collection in the new platform. Otherwise, you might be unable to keep your important data history for future reference.
Given the significant updates in Google Analytics 4, we will dive deeper into how it differs from its predecessor. In this article, we will cover various aspects of Google Analytics 4, including its key changes, setup methods, event and conversion measurement, and reporting features.
Download website launch checklist
What Has Changed in Google Analytics 4
There are four key differences between Google Analytics 4 and Universal Analytics:
- Multi-platform measurement. With Google Analytics 4, you can collect data not only from your website but also iOS and Android apps.
- Privacy configuration. Google Analytics 4 comes with new privacy controls, including cookieless measurement, to ensure that website owners can collect user data more ethically. The platform will also no longer keep IP addresses.
- Event-based tracking. It replaces session-based data tracking, allowing you to measure user behavior and conversions to have a complete view of the customer journey.
- Predictive metrics. Using Google’s machine learning model, predictive analytics lets you project future user behavior, such as the purchase or churn probabilities and predicted revenue.
Suggested Reading
Google Analytics 4’s AI features
Google Search Console Tutorial
How to Set Up Google Analytics 4
There are two ways to set up Google Analytics 4 – using Google Tag Manager and updating configuration settings with Setup Assistant.
New users should go with the Google Tag Manager method. Meanwhile, existing users should migrate their Universal Analytics properties with the latter as they already have it installed.
Method 1. Set Up GA 4 With Google Tag Manager
In this part, we will cover the steps to installing Google Analytics 4 with Google Tag Manager. As this method is intended for new users, let’s start with downloading Google Analytics 4.
- Visit the Google Analytics homepage and click Get started today. Then, follow the instructions to log in with your Google account.
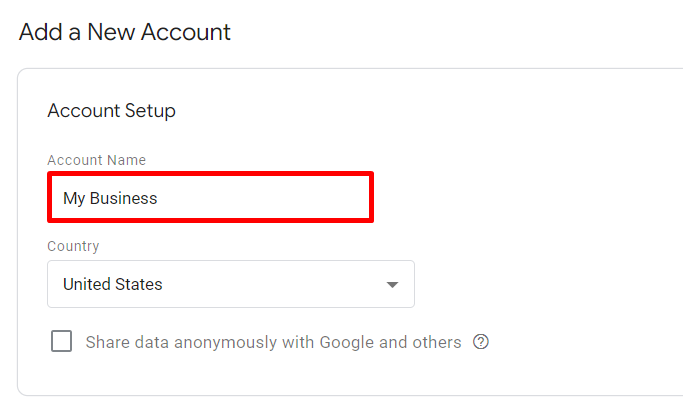
- Fill in the details in the Account Setup with an account name you will use as your profile. For example, your company name.
- Under the Account details, you will see the Account Data Sharing Settings to configure your account data sharing with other Google products and services. Simply enable or disable data share functions by ticking the options.
- Click Next to continue the setup.
- In Property Setup, create a property to measure your data. In this example, we will set up a website property. Once you’ve finished setting up your property, click Next.
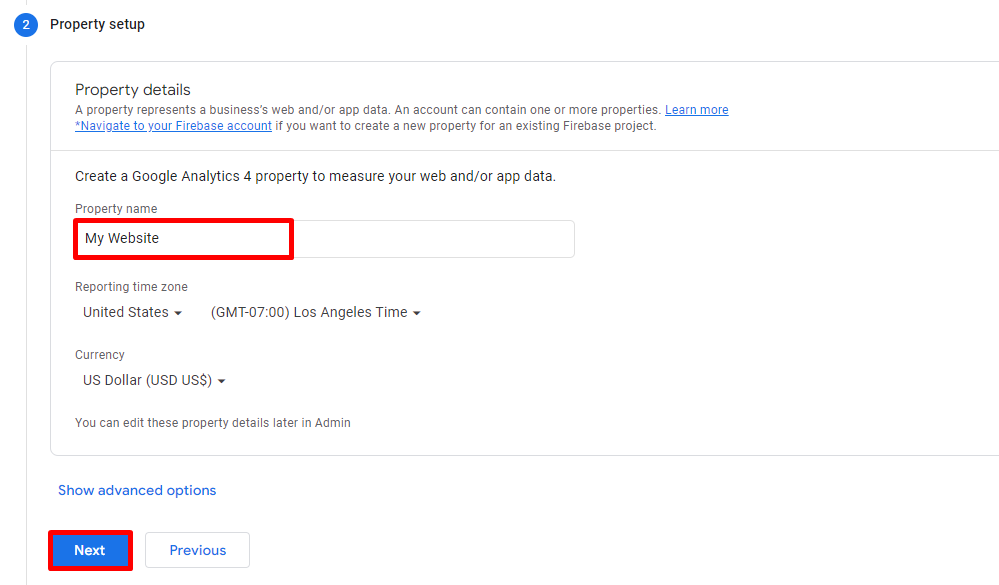
Use a name that is easy to remember since you may use multiple properties to measure your data. However, you can always edit property details and create new properties by navigating to the Admin tab -> Property column on your Google Analytics interface.
- Lastly, provide more information about your business by selecting its industry category, size, and how you will use Google Analytics 4 for your needs.
- Then, click Create to finalize your Google Analytics account setting.
- A Terms of Service Agreement window will pop up. Choose your country and region from the drop-down list and read the terms before ticking the GDPR term. Click I Accept to finish the account setup.
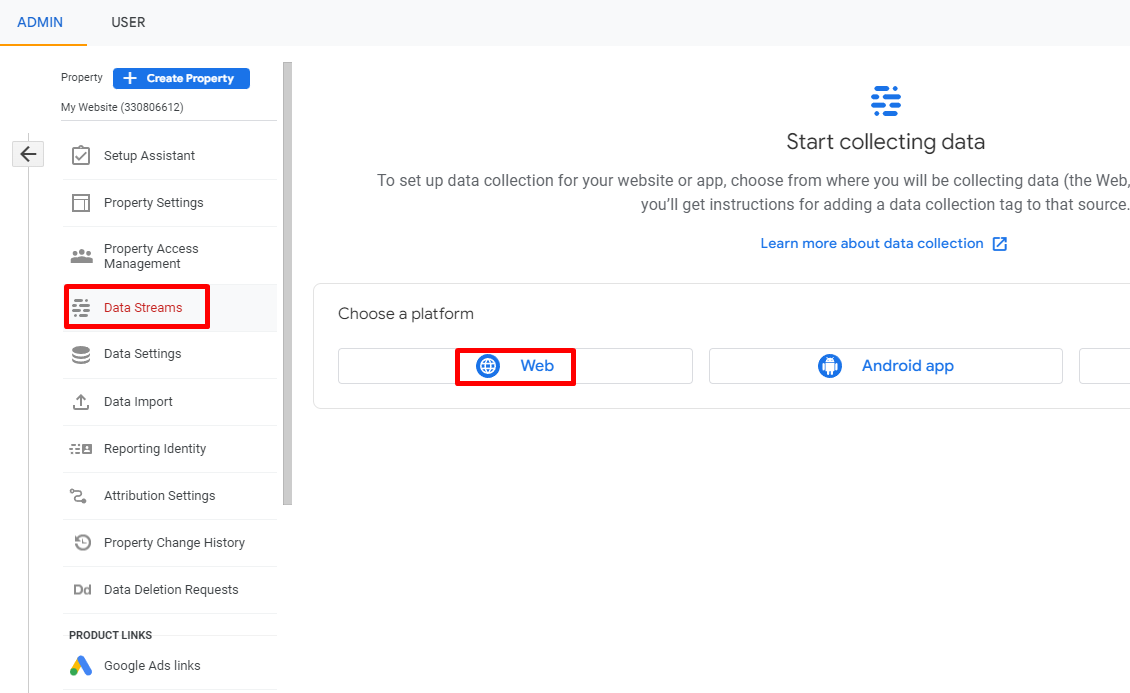
- Navigate to your dashboard and click the Admin tab. Then, choose Data Streams under Property. Choose Web to enable data collection for your site.
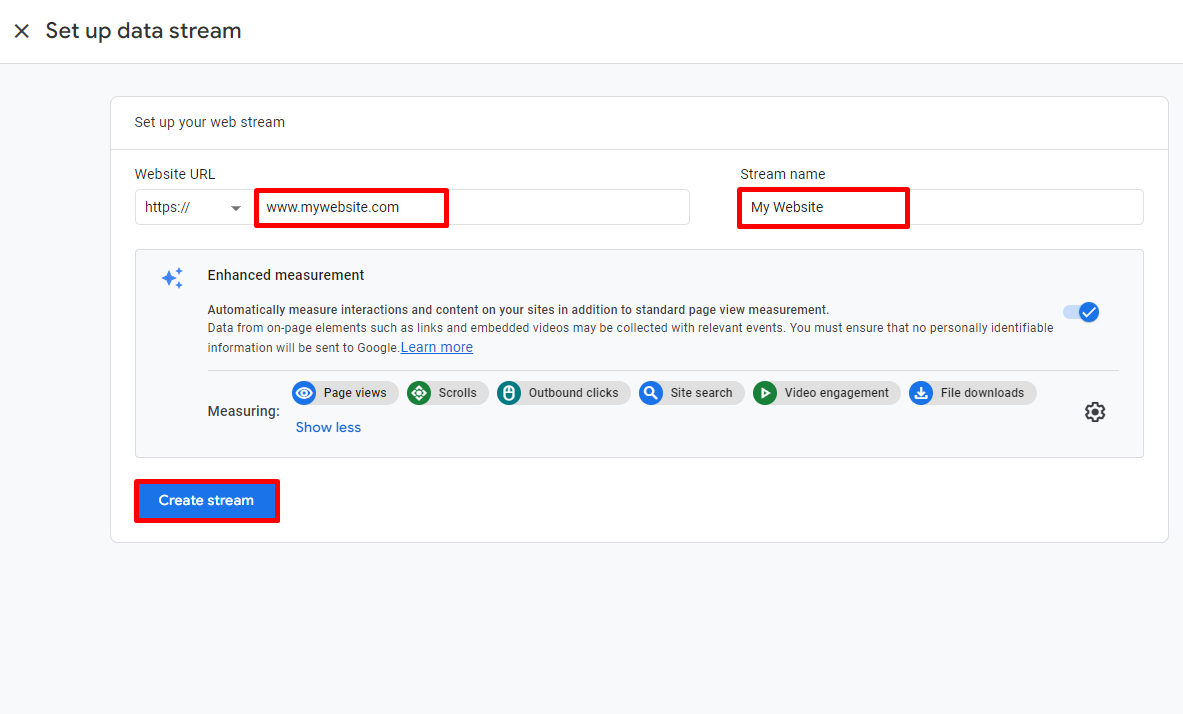
- Enter your website URL and create a stream name. Then, click Create stream.
- Once you’ve set up a web data stream for data collection usage, you will find it under the Data Streams section. Feel free to add more data streams if you want to enable tracking on multiple platforms.
The steps to set up a Google Analytics account are complete. Now, follow the guidelines below to create a Google Tag Manager account.
- Go to the Google Tag Manager homepage. Log in with your Google account, and proceed to the Account Setup. Enter your business name and choose the country you operate in.
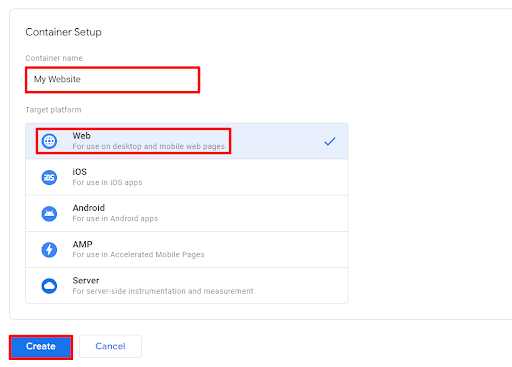
- On Container Setup, create a container name and choose your target platform. For example, enter your website name and click on Web if you want to measure your site. Then, click Create.
- The Google Tag Manager Terms of Service Agreement will show. Tick on the GDPR condition, then click Yes.
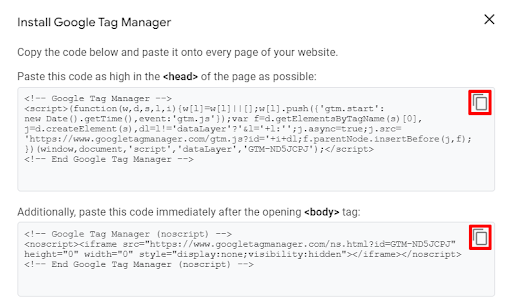
- You will see the code snippets to paste on the <head> and <body> tags on your website. As an example, we will show you how to add these code snippets to a WordPress website.
Simply click the copy icon on each tracking code and head to your WordPress admin page.
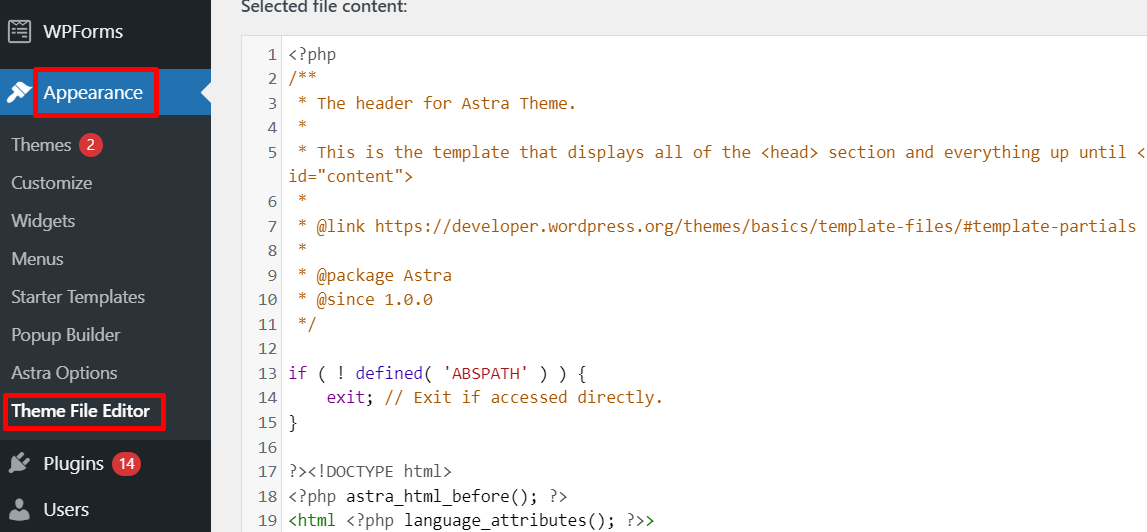
- On your sidebar, click Appearance -> Theme File Editor.
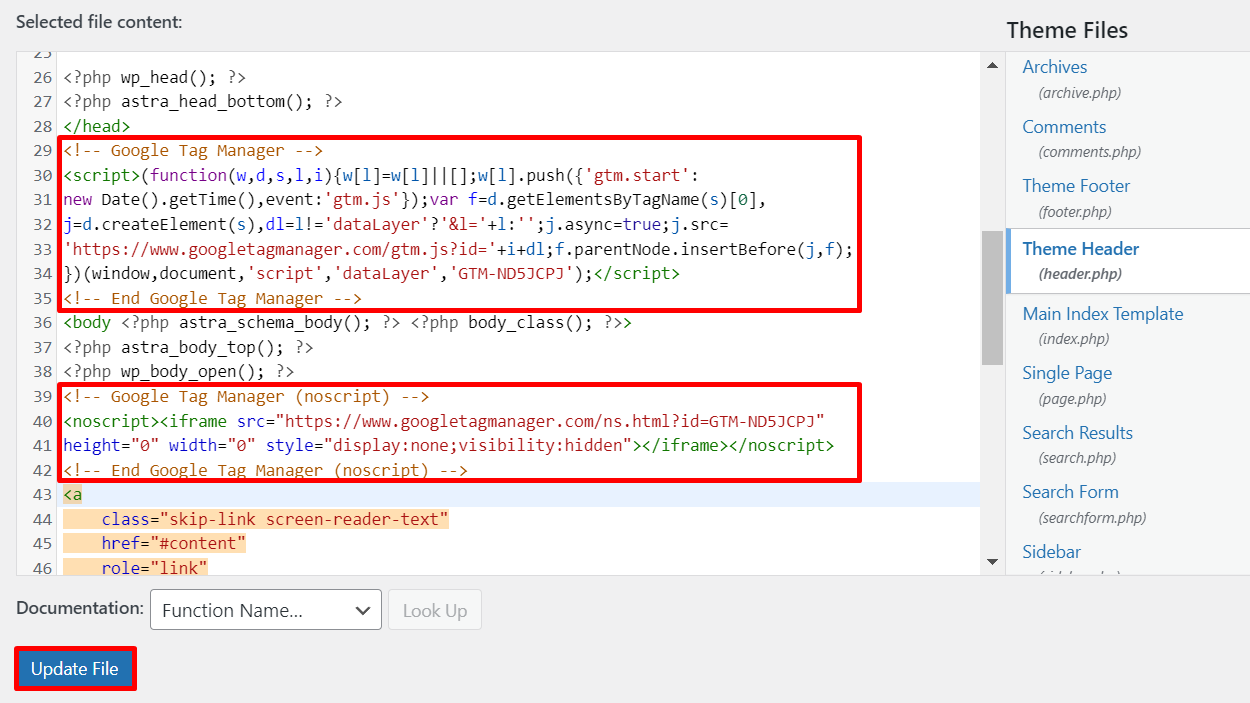
- Locate the header.php template under the Theme Files and copy the code snippets to the <head> and <body> tags.
- Once done, click Update File to save your settings.
- Navigate to your Google Tag Manager dashboard and click Add a new tag.
- Click anywhere on the Tag Configuration part to see the tag type options from Google Tag Manager.
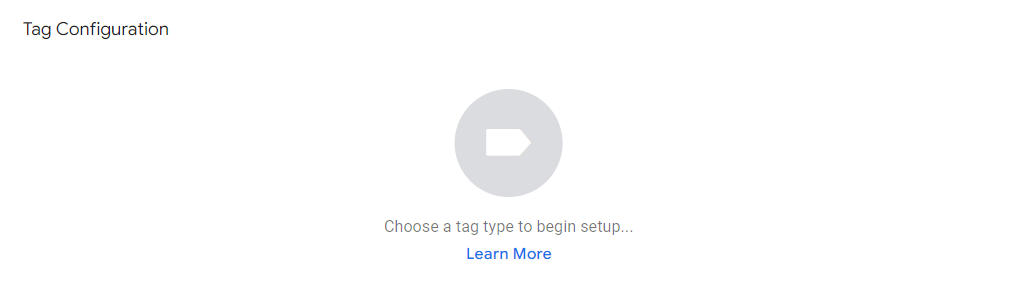
- Choose the Google Analytics: GA4 Configuration option, and the configuration window will show up.
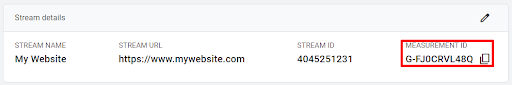
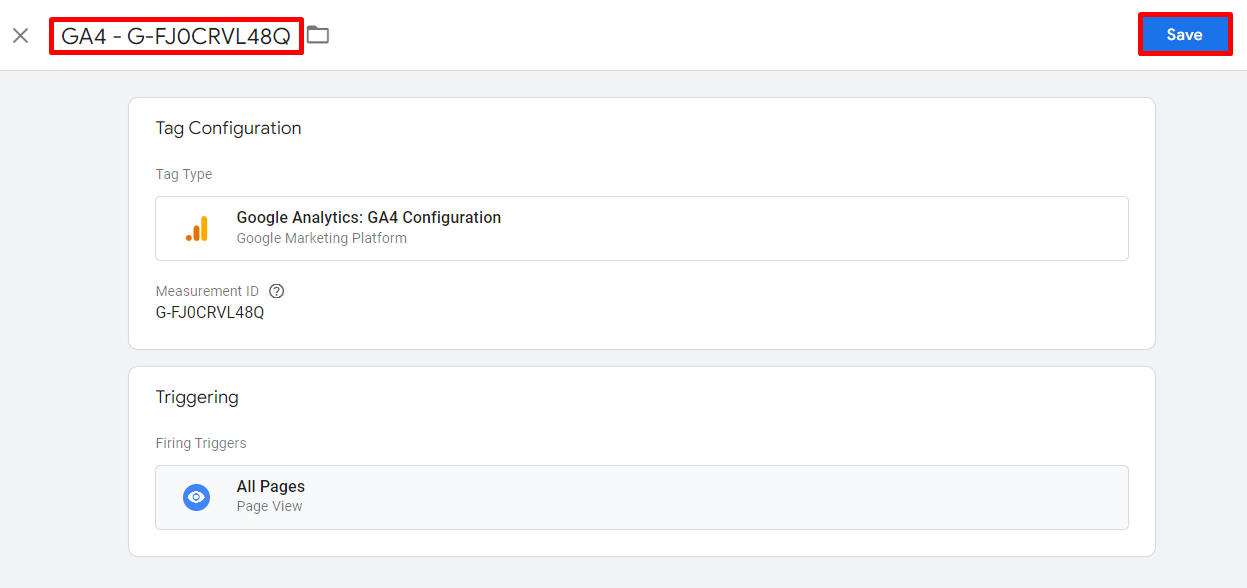
- Enter your Measurement ID on the tag configuration. You can find it in Admin -> Property -> Data Streams. Select the data stream you’ve created, and you will see your ID. Simply copy it to the Tag Configuration window.
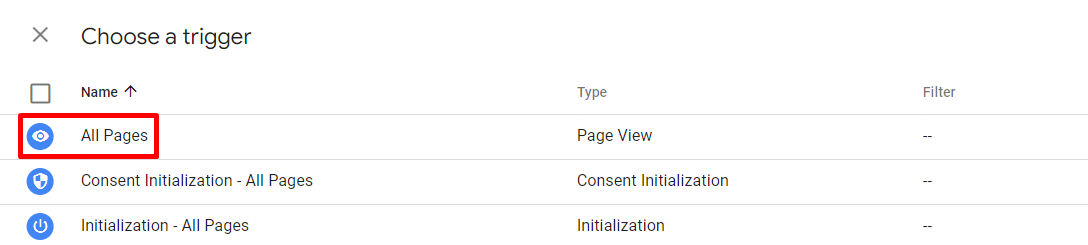
- Follow through with the Triggering setup. Click anywhere on the Triggering section to choose the triggers. In this example, we will be using All Pages.
- Create a name for the tag and click Save. As it is possible to have several containers under the same user account, name your tag with your measurement ID to help you identify each tracking tag quickly.
- Then, check if your tag is working in the Preview mode.

- Once you click on it, the Tag Assistant window will pop up. Simply enter your website URL and click Continue.
- The “Tag Assistant connected” message will show up in a new window, meaning the tag installation on your website is successful. Click Finish, then click Continue to close the preview mode.
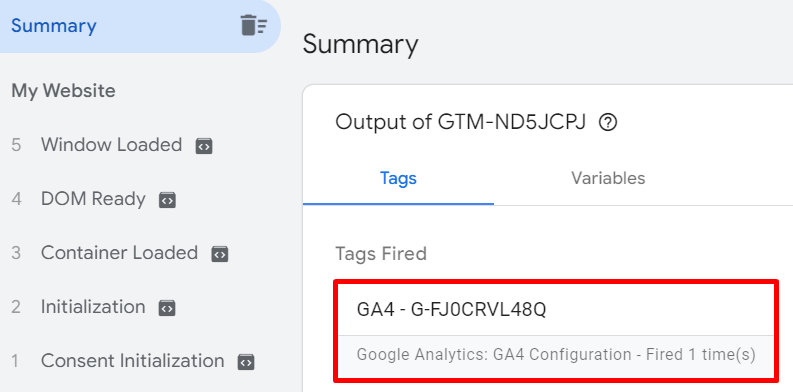
- You will see some stats on the Summary page. In this example, the tag has fired successfully.
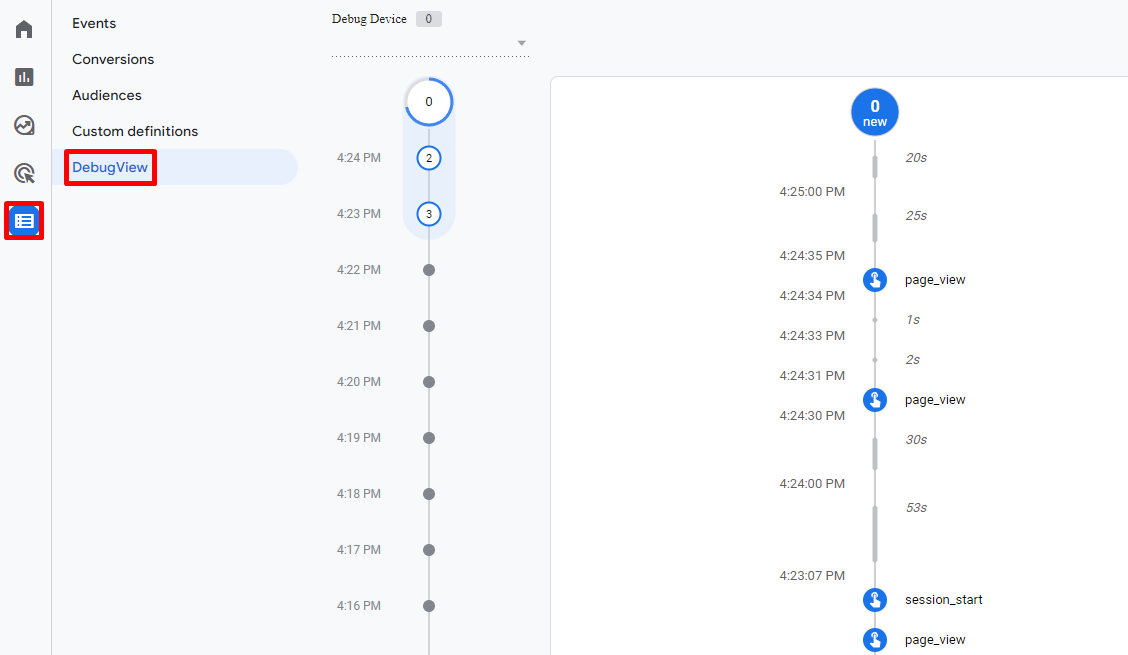
- Then, use DebugView to ensure Google Analytics 4 collects the data. To do so, navigate to your Google Analytics dashboard and click on Configure -> DebugView on your sidebar. You will see this data with the event name, time, and duration details.
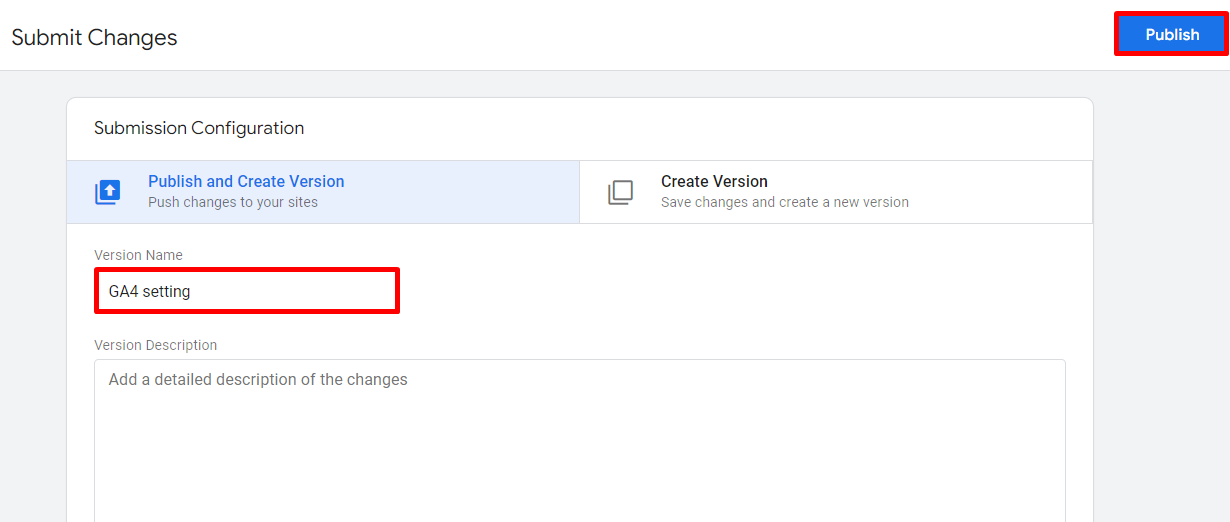
- After ensuring the data collection worked with DebugView, go back to your Google Tag Manager dashboard and click Submit.

- Create a Version Name and click Publish to finalize the tracking setup.
Method 2. Configure Google Analytics 4 With Setup Assistant
The GA4 Setup Assistant makes the configuration process for existing Google Analytics account owners more straightforward.
This is because you can create a new GA4 property without changing your Universal Analytics account. Then, your existing property will keep collecting data on your website together with your new GA4 property.
To do so, follow these steps:
- On your Google Analytics dashboard, navigate to Admin. Choose your desired account and select the Universal Analytics property you want to migrate from the dropdown menu. Then, click the GA4 Setup Assistant.
- You will see an option to create a GA4 property that mirrors your existing Universal Analytics property. Click Get started.

- Once the GA4 property setup is complete, you will see your property and data stream details.
Now you can add a new tag to start tracking your website. How to do so, we’ve explained in the previous method.
Important! You won’t be able to use your existing tags if you’re using Google Tag Manager or a website builder, or a content management system that doesn’t support gtag.js during migration. Therefore, you will need to add the gtag.js tag on your own using custom HTML when moving to Google Analytics 4.
How to Track Events With Google Analytics 4
Google Analytics 4 will measure user interactions on your website and iOS or Android apps as events. Unlike Universal Analytics which relies on session-based data, this cross-platform tracking is the basis of GA4’s measurement model.
There are four types of events in Google Analytics 4:
Automatically Tracked Events
Google Analytics 4 collects some event data automatically when you set up a tag on your website.
For example, when using Google Tag Manager’s preview mode, each time a tag fires will automatically be sent as an event.
Enhanced Measurement Events
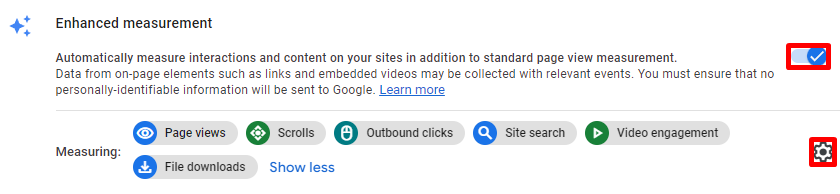
Enabled enhanced measurement is the default setting when creating a data stream. It allows Google Analytics 4 to track user interaction on the platform automatically, including page views, scrolls, outbound clicks, video engagement, and file downloads. Let’s have a closer look at them:
- Page_view – Google Analytics collects this event automatically when the page loads or the browser history changes. You can track this event with the Views metric, page_location, and page_referrer dimensions.
- Scroll – event data will be sent when a visitor scrolls at least 90% of a site page for the first time. To track this event, check the percent scrolled dimension.
- Click – this event is sent each time a visitor clicks a link that leads to another domain. Along with the event data, you will get parameters including link_classes, link_domain, link_id, link_url, and outbound.
- View_search_results – Google Analytics gets this data when parameters like search, query, and keyword appear on a page URL when a visitor performs a site search. Locate this data in the Search term dimension.
- Video_start, video_progress, video_complete – an event will be sent when the embedded video starts playing, progresses from 10% to 75% of the total duration time, and completes.
- File_download – collects data on any file a visitor downloads, including text, executable, audio, video, presentation, or compressed files.
Remember to enable the enhanced measurement setting first. Navigate to Admin -> Property -> Data Stream by clicking on the toggle. For this setting, Google Analytics 4 also performs automatic data collection.
If you wish to disable some event tracking in enhanced measurement, click on the settings icon to adjust the configuration.
Recommended Events
Recommended events enable you to track additional events across platforms using predefined event names and parameters, such as online sales and game properties.
This event type is also helpful for eCommerce tracking as it lets you create the ad_impression, share, and search events to measure customer engagement. As an example, we will show you how to track a search event using Google Tag Manager.
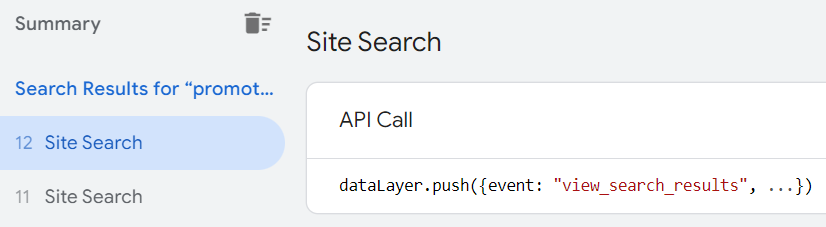
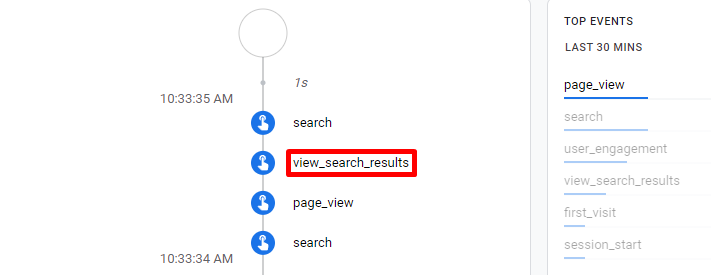
First, navigate to your Google Tag Manager dashboard and enable the preview mode. When the new window to your site opens, try searching for a keyword on your search bar, for instance, “promotion”.
Close the preview mode, and you will see the summary containing Site Search with a data layer.
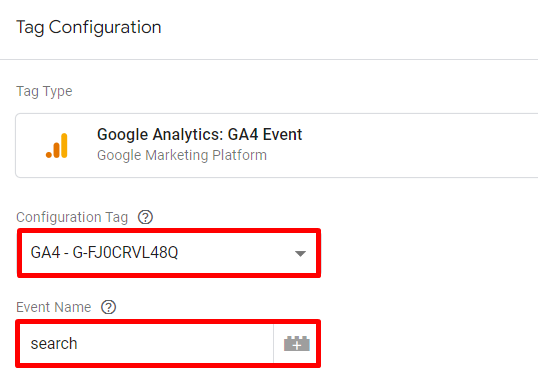
After that, create a new tag. In the tag configuration, choose Google Analytics: GA4 Event. Then, select your Google Analytics 4 configuration tag from the list and enter the event name. Use the exact name in Google’s documentation for recommended events.
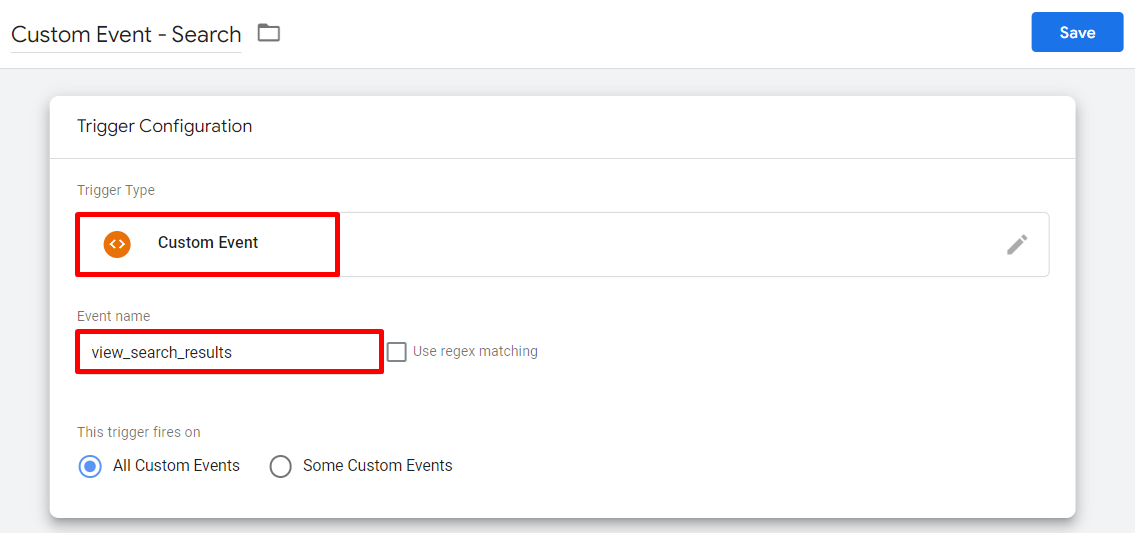
Scroll down to add a trigger. As you are creating a new condition, click on the + button at the top of the page.

Choose the Custom Event trigger type and enter the event name. Use the exact name in the data layer without the quotes. In this case, we will use view_search_results. Then, name the trigger, for example, “Custom event – Search”. Finally, click Save.
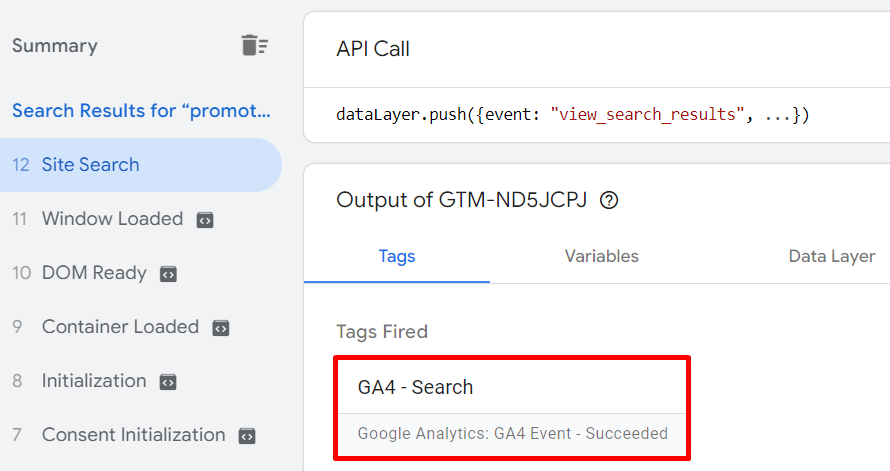
Then, name the tag and click Save. As an example, we will call it GA4 – Search.
Continue to preview mode and use the search feature on your website. Then, check if the tag fired successfully.
Finally, navigate to Google Analytics 4 and click Configure -> DebugView to ensure it collects the data.
Custom Events
You can measure other events unavailable in recommended events list by creating a custom event. In this section, we will explain how to track it using Google Tag Manager.
Suppose you own an online bookstore and want to track visitors who clicked on the preorder button. To do so, follow the steps below:
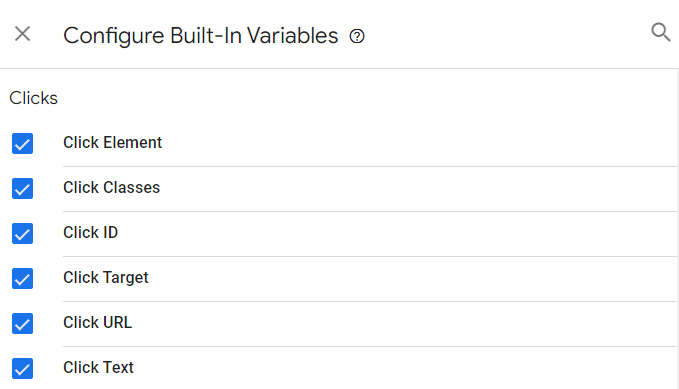
- Open your Google Tag Manager dashboard and click on the Variables column -> Configure.
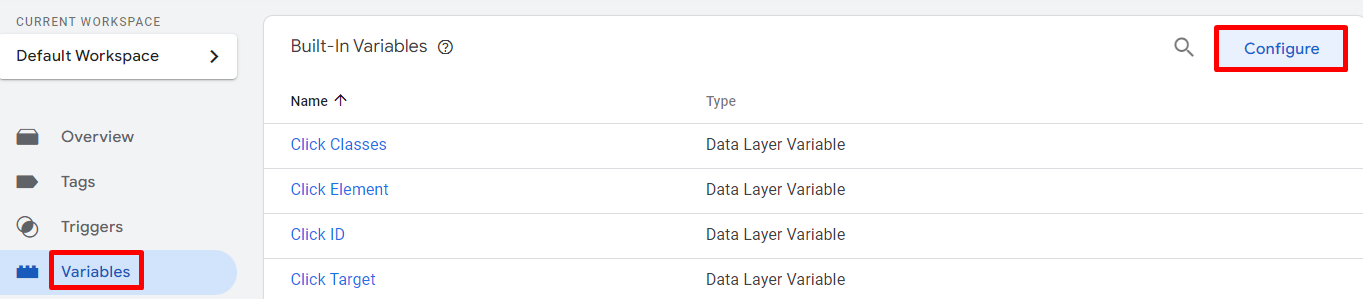
- Scroll down to Clicks and enable all the clicks variables.
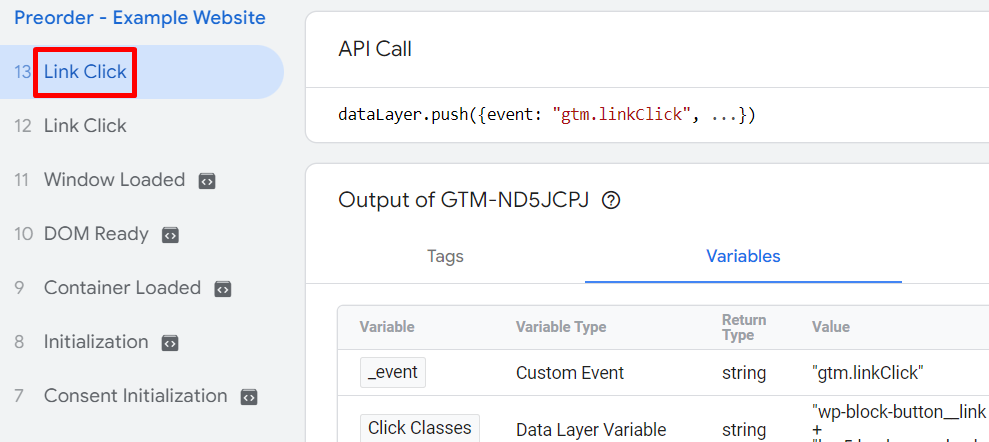
- Then, go to your Google Tag Manager dashboard and click Preview. Click on the Preorder button on your site.

- Close the Tag Assistant window, and you will see the summary containing the data layer and click classes for the link click event.
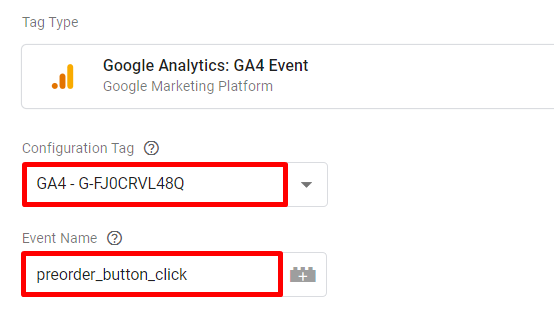
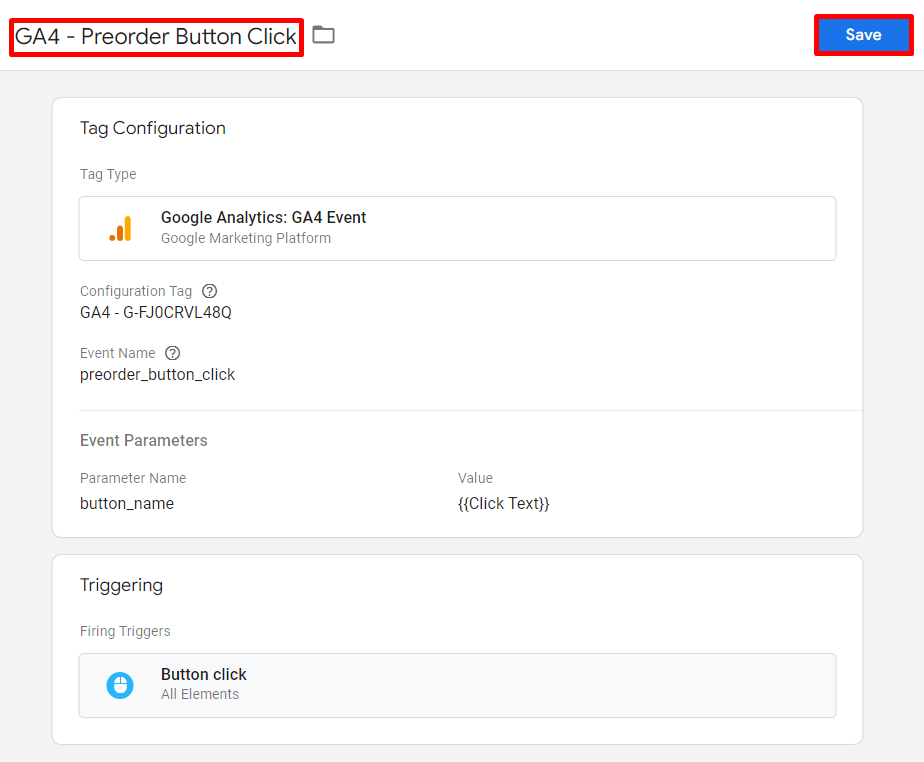
- Now, create a new tag using Google Analytics: GA4 Event, and select your configuration tag. Then, create your own event name instead of using pre-defined event names from the Google Analytics 4 documentation.
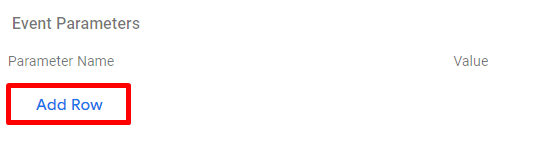
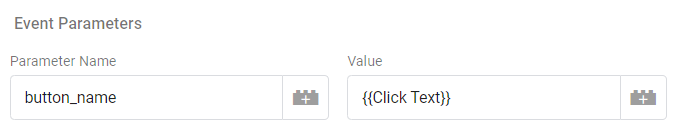
- Navigate to the Event parameter column and click Add row.
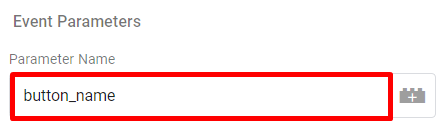
- Add a custom parameter name. In this example, we will use button_name.
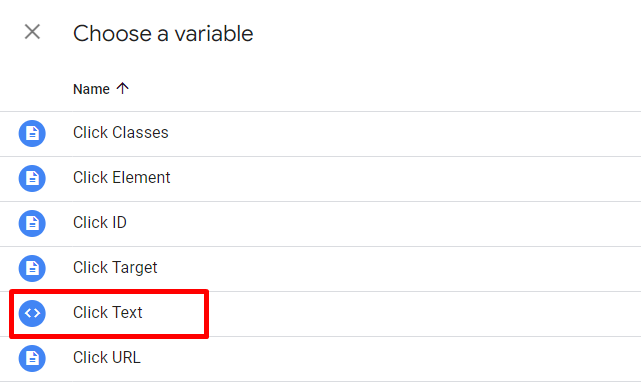
- For value, click on the plus (+) and select the Click Text variable from the list.
- After that, ensure your event parameter is set up like this.
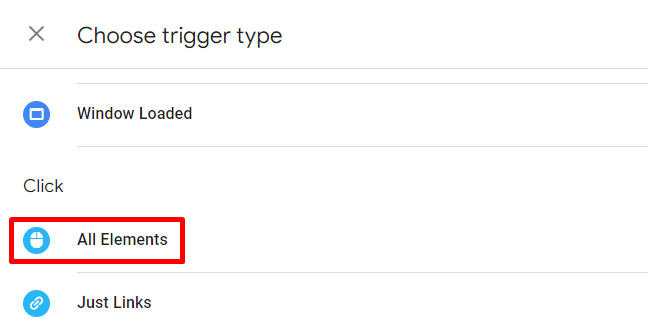
- Then, create a new trigger. Click on the + on top of the page and select All elements.
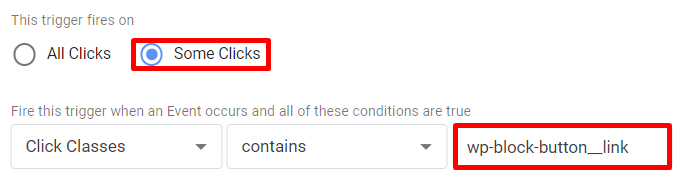
- Configure the trigger condition. Choose Some Clicks, and copy the Click Classes value from your summary page to the triggering configuration panel.
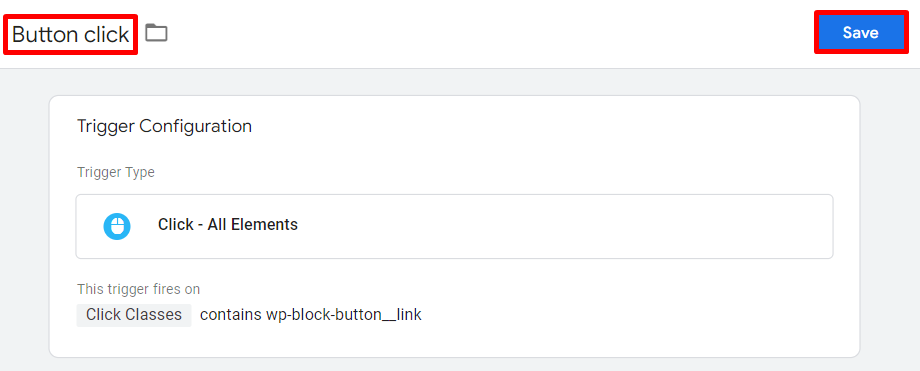
- Name your trigger and click Save.
- Lastly, create a name for your tag to finalize the setup and click Save.
Finally, use the preview mode and DebugView we’ve explained earlier to ensure the tag fires and Google Analytics 4 collects the data.
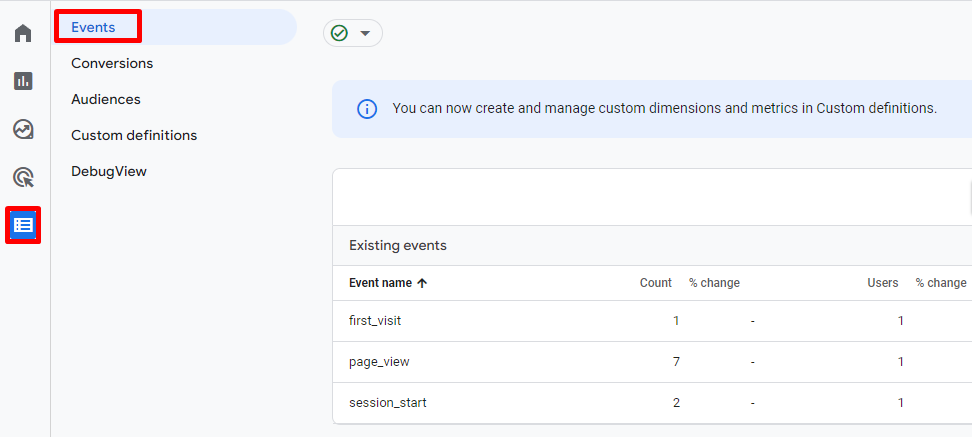
To monitor all your events in Google Analytics 4, navigate to Configure -> Events on your dashboard. They will appear in the existing events table in a day together with automatically tracked events.
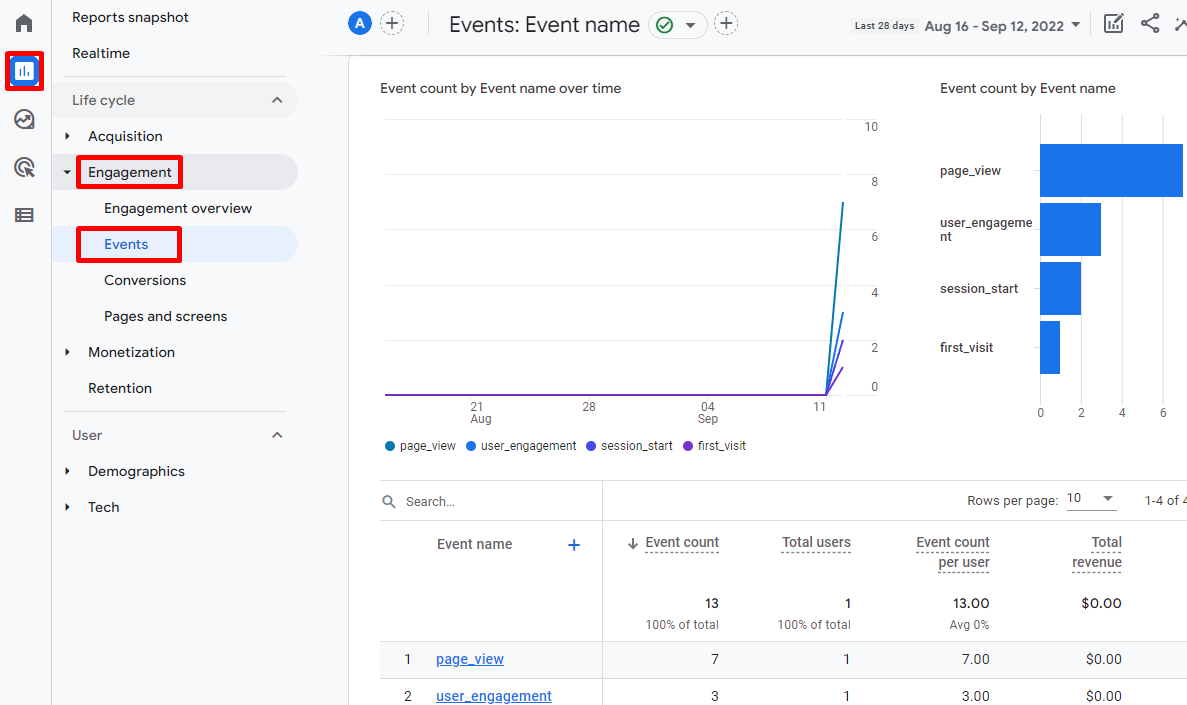
Another way to see your events is by clicking on Reports -> Engagement -> Events on the user interface. This option lets you have a more detailed view of your events in a certain date range from one dashboard.
How to Track Conversions With Google Analytics 4
Google Analytics 4 groups conversion events for web and app measurement. Only the purchase conversion event is trackable on both platforms. Meanwhile, the following are default conversion events for apps:
- First_open
- In_app_purchase
- App_store_subscription_convert
- App_store_subscription_renew
Using the Google Analytics 4 configuration, there are five ways to measure conversion rates on your website and app without having to code:
Mark Existing Events as Conversions
Track existing events as conversions by navigating to Configure -> Events, and you will see your events on a table. Under the Mark as conversion column, click the toggle to activate the feature.
Create a New Conversion Event
With Google Analytics 4, you can create an event based on your existing event to perform more specific conversion tracking.
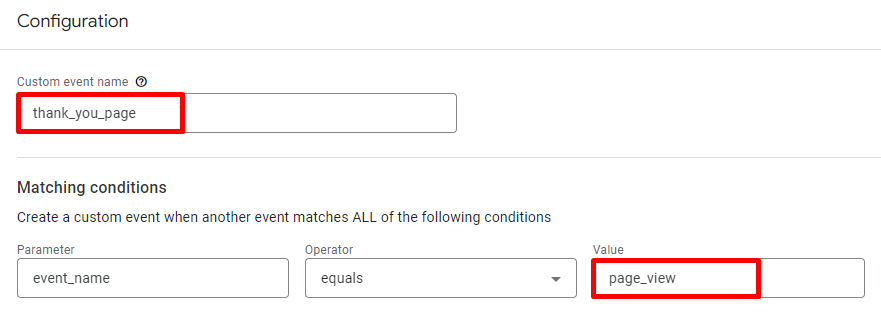
For example, let’s create a thank-you page from the page_view event. This event will pop up each time a visitor fills out a contact information form on your site, allowing you to see how many data submissions you get by tracking the thank-you page views.
To do so, follow the steps below:
- Navigate to Configure -> Events. Click on the Create event button.
- Click Create, and you will see a configuration panel.
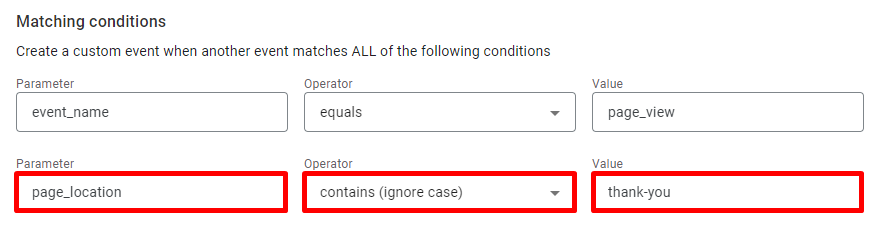
- Create an event name, for instance, thank_you_page. In the Matching conditions part, enter the exact existing event name: page_view. Once done, click Add condition.
- On the second row of Matching conditions, choose page_location on the Parameter field. For Operator, select contains (ignore case).
- Then, create the page name under Value. In this example, we will use thank-you.
- Click Create. Note that it will take some time for the created event to show in the Existing events table.
- When the event shows up, mark it as conversion by clicking Configure -> Conversions -> New conversion event. Enter the exact name for the new event, thank_you_page.
- Finally, click Save.
Add Custom Parameters and Conditions
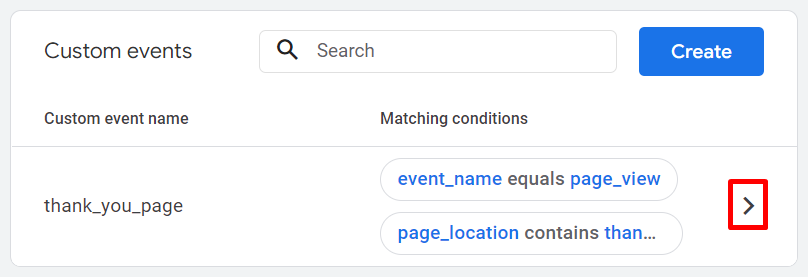
You can adjust the setting for a custom event created based on an existing event by navigating to Configure -> Events -> Create event.
Select the event to modify on the Custom events table, then click the arrow to access the configuration panel.
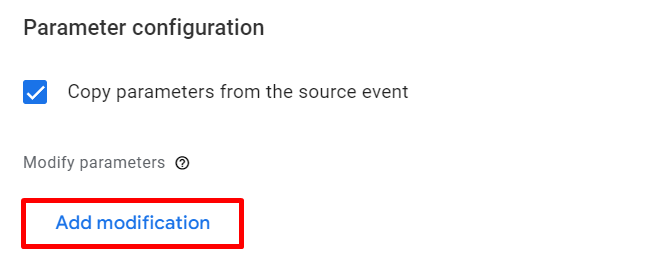
Scroll down to the Parameter configuration part and click Add modification. Then, add new conditions or custom parameters and click Save.
Add Monetary Value
Recommended events like online sales events have the value and currency parameters. However, you can also add monetary value to other events by adding a currency parameter and specifying a numbered value.
Simply click Configure -> Events -> Create event, select an event from the Custom events table, and adjust the Parameter configuration.
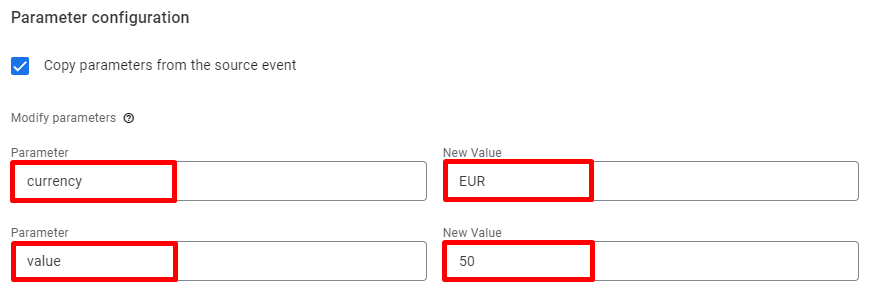
Once you’ve done modifying the parameter, click Save.
Stop Conversion Events Tracking
To stop collecting this event data on Google Analytics 4, navigate to Configure -> Events. Select the conversion you want to disable on the Existing events table.
If you can’t locate the event in the table, click on the Conversions tab to display the Conversion events table. Then, turn the toggle off in the Mark as conversion column.
How to Track Reports in Google Analytics 4
Google Analytics 4 provides a default set of reporting features to help you examine your data across various platforms. We will cover each report type and how they work.
Realtime Report
The realtime report displays user activities on your site and mobile apps once they happen. This report will show data such as the number of active users in the last 30 minutes, referral information, page title your users engage with, event count by its name, and conversions.
To get this report, navigate to your sidebar and click Reports -> Realtime.
Life Cycle Reporting
The life cycle is a default Google Analytics 4 report providing user activity data at each step of the customer journey.
The life cycle collection includes four types of reports:
- Acquisition – shows how a user reaches your website or app and its traffic data, letting you see whether your marketing strategy to drive traffic works. Default acquisition reports typically include the overview, user acquisition, and Google ads campaigns.
- Engagement – displays the pages and screens with the most user engagement, giving you insights into your visitors’ behavior.
- Monetization – reveals your revenue from eCommerce purchases, publisher ads, and in-app purchases. Furthermore, you can see how many customers view your products and impression data from apps.
- Retention – collects data on your most frequent users and how long they spent on your site or app. Additionally, a retention report enables you to compare how these users generate additional revenue after their first visit.
Find the life cycle report by clicking Reports on your GA4 sidebar. Then you will see the Life cycle dropdown list with Acquisition, Engagement, Monetization, and Retention options.
Pro Tip
Google Analytics 4 will provide a Games reporting collection if you’re setting Games as your account’s business industry and at least 50% of app data streams associated with the game.
User Collection Report
The user reporting interface in Google Analytics 4 lets you learn more about your visitor profiles, including their age, interests, and devices. By default, you will find detailed information under these categories:
- Demographics – identify the age, location, language, gender, and interests of your visitors.
- Tech – see the devices your visitors use, including mobile, tablet, and desktop.
Navigate to Reports -> User on your sidebar to access this reporting feature.
How to Import Data to Google Analytics 4
The data import feature in Google Analytics 4 allows uploading external information to connect it with your data.
For example, as a digital marketer, you may have data from a CRM tool containing information on your customer segments. Import and measure these data on Google Analytics 4 to gain valuable insights.
Here are the supported data types you can upload to Google Analytics 4 using this feature:
- Item data
- Cost data
- Offline events
- User data
Note that data import functions in two methods:
Uploading Data
This method allows you to upload external data exported from CRM, spreadsheets, or other business tools in CSV file format. Then, combining it with your Analytics data can give you more detailed reports.
Joining Data
Based on the important data type, Google Analytics 4 will merge your data in two ways:
- Collection/Processing time – merges user and offline-event data. As a result, the external data will be added as the Analytics collect data from events as they happen.
- Reporting/Query time – connects data types like cost and item. However, this merged data will be unavailable when you’re creating an audience in Analytics or doing segmentation using Explorations.
To import external data to Google Analytics 4, follow these steps:
- Navigate to the Admin tab.
- Choose your account and property, then click Data Import under the Property column.

- Click Create data source.
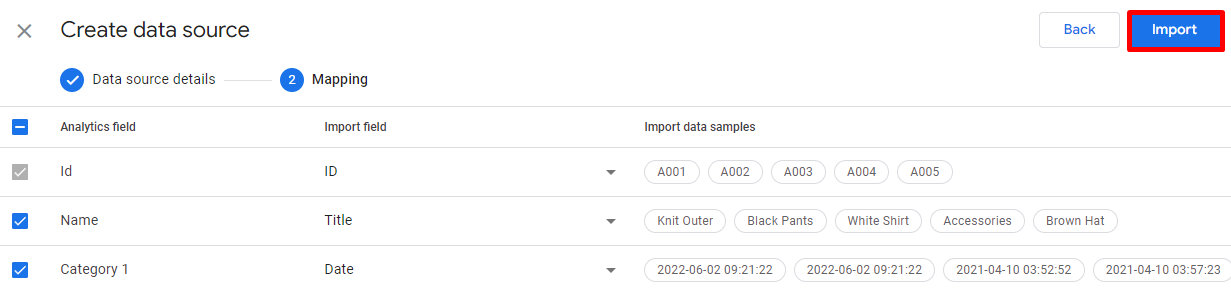
- Create a data source name, for example, Product data. Then, select the data type, continue to Upload CSV, and click Next.

- Select the analytics field and import field, then click Import. Your data will be available for download shortly.
Important! Note that there will be a 10 GB cumulative limit for daily data uploads with a maximum of 24 uploads.
Types of Analysis in GA4
Besides the standard reports, Google Analytics 4 offers an advanced Explorations feature that lets you use different analysis techniques to gain deeper insights into your data. This is not a new feature – it was known as the Analysis hub in Universal Analytics.
Google Analytics 4 has improved it by providing six exploration techniques you can access through your Analytics sidebar. Click Explore -> Template gallery to enable this feature.
Let’s take a look at each of the analysis techniques.
Free Form
This analysis technique offers flexibility to customize a report however you like. Add combinations of segments, dimensions, custom metrics, and data visualization graphs to analyze specific business data.
User Exploration
This technique lets you understand a customer’s individual behaviour when interacting with your website or app. Use this analysis technique to learn more about your user segments.
Funnel Exploration
Use this technique to visualize customer journey to learn how they interact with your site and apps to complete an event. You can break down the steps to identify new buyers and returning customers to optimize the user experience and retain customers.
Path Exploration
Path exploration or analysis technique allows you to create a tree graph that visualizes your users’ steps when interacting with your site and apps. Therefore, you can identify how their behaviors trigger events and see users’ previous and following actions when completing an event.
Segment Overlap
The segment overlap technique allows you to compare three user segments to see how they correlate. This technique can be helpful when you want to distinguish overlapping audience profiles and create new segments.
User Lifetime
With user lifetime analysis, you can analyze your user behavior over their lifetime as customers of your website and apps. Additionally, this technique lets you track previous campaigns generating users with the highest lifetime revenue, purchase probability of your active campaigns, and unique user behaviour.
Cohort Exploration
Cohort analysis lets you explore a group of users that share similar attributes over time. For example, you can group users based on the same acquisition date and compare them using several metrics.

Conclusion
Google Analytics 4 provides new features, such as event tracking, to make data measurement easier. While you can track different types of events – automatic, recommended, and custom ones, it is also possible to benefit from using only default conversion events in Google Analytics 4.
There are two ways to install Google Analytics 4: using Google Tag Manager for new users and GA Setup assistant for existing users. To maintain your historical data, we recommend existing users perform early data migration to Google Analytics 4.
With the new Google Analytics version, utilize the data import feature to upload external information from other business tools. Also, apply several exploration analysis techniques to obtain complete data reports and uncover profound insights into your business.
We hope this article helps new and experienced Analytics users optimize marketing strategies and drive more website traffic. Good luck with your digital analytics journey.
Learn More About Website Creation
How to Make a Website
How to Upload Your Website
15 Best CMS Platforms to Start a Website
How to Design a Website
Google Analytics 4 Tutorial FAQ
To learn more about Google Analytics 4 and its benefits compared to Universal Analytics, check out our list of the most asked questions below.
When Was Google Analytics 4 Released?
Google Analytics 4 was first introduced in 2020 and has undergone numerous developments since then. Recently, Google has announced that Google Analytics 4 will be its standard measurement solution from July 2023.
Is Google Analytics 4 Better than the Previous Version?
Yes. Google Analytics 4 provides improved features with cross-platform tracking and predictive analytics using Google’s machine learning. It also simplifies the reporting feature in Universal Analytics to further help marketers and business owners understand their customer behaviour.
Should I Use Google Analytics 4?
Yes. We recommend using Google Analytics 4 since Universal Analytics will stop processing data next year. For existing Universal Analytics users, consider creating a new Google Analytics 4 property in parallel with your existing Universal Analytics one.
All of the tutorial content on this website is subject to Hostinger's rigorous editorial standards and values.

Nadia is a curious thinker that enjoys sharing her IT and digital marketing knowledge through written pieces and helping people success online. In her free time, she spends time in the streets or cafes learning about architecture and culture through urban sketching.


Comments
December 13 2022
hi, thanks for this useful tutorial, i have question, i just made the tag for preorder button and every thing is working fine, but it does not appear as an event in my google analytics account. the triggers is firing and in debug view i can see my tag working, but is this data collected?
December 15 2022
Hey there! If your eCommerce tag does not reflect in your Google Analytics data this indicates an issue with the configuration. It is critical that Data Layer be formatted exactly as Google specifies in its documentation. This includes the data structure, attribute names, value format, and so on.