400 Bad Request error: What it means & how to fix it
Aug 05, 2025
/
Ariffud M. & Simon L.
/
8 min Read

A 400 Bad Request is an HTTP error that means your browser sent a request that the server couldn’t understand or process. Most of these errors happen because of simple issues, like an invalid URL, outdated cache files and cookies, or an uploaded file that exceeds the server’s limits.
The good news is that you can usually solve them in just a few minutes with some basic troubleshooting steps:
- Use a fast network connection.
- Make sure the URL is correct.
- Clear browser cache and cookies.
- Turn off browser extensions.
- Flush the DNS cache on your computer.
- Reduce the files you want to upload.
If you’re a website owner, you also need to perform regular audits to keep your site free from any 4XX errors.
Here’s how to get your website loading again and what to do if the standard fixes don’t work.
What does a 400 Bad Request error mean?
A 400 Bad Request error means the server received your request but couldn’t process it because something was wrong with how it was formatted or what it contained. This is one of the HTTP 4XX status codes that indicates a client-side problem.
What is a 400 Bad Request in simple terms? Think of it like sending a letter with an incomplete address. The post office gets your letter, but can’t deliver it because they can’t figure out where to send it.
Here are the main causes:
| Cause | Description |
| URL syntax errors | Typos, extra spaces, or missing characters like = or & in the web address. |
| Browser issues | Corrupted cache files, outdated cookies, or conflicting extensions. |
| Outdated DNS cache | Your computer has old website address information that doesn’t match current records. |
| File size too large | Uploaded files, images, or cookie data exceed the server’s size limits. |
| Malformed request headers | Browser sends incorrectly formatted information the server can’t read. |
| Invalid characters | Special symbols or encoding that the server doesn’t recognize. |
The problem is that most of the time, you will see a generic error message without any context, so it’s hard to know what exactly went wrong.
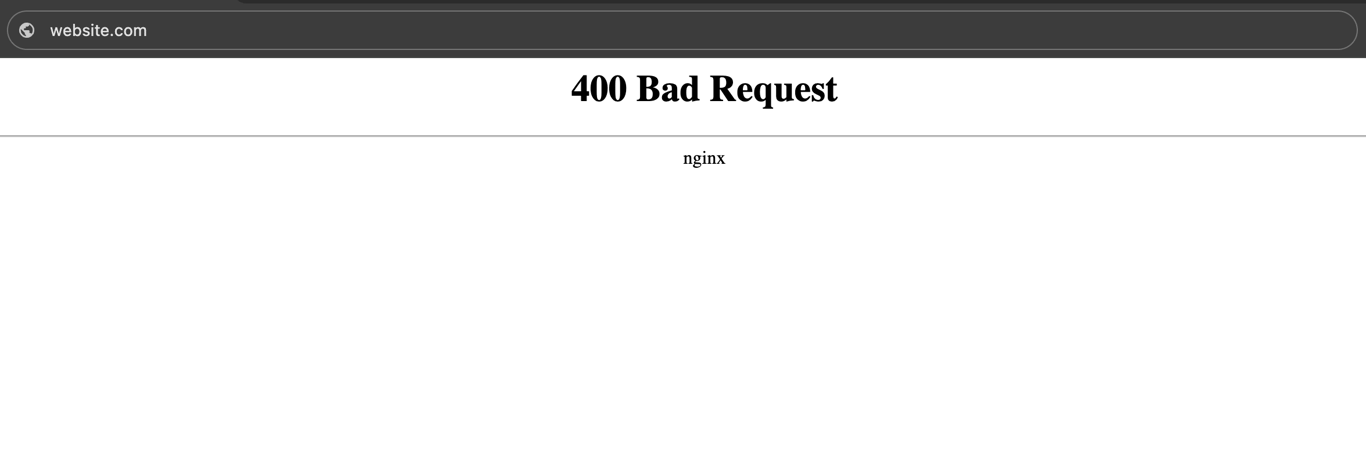
Here’s what a 400 Bad Request error looks in Google Chrome:
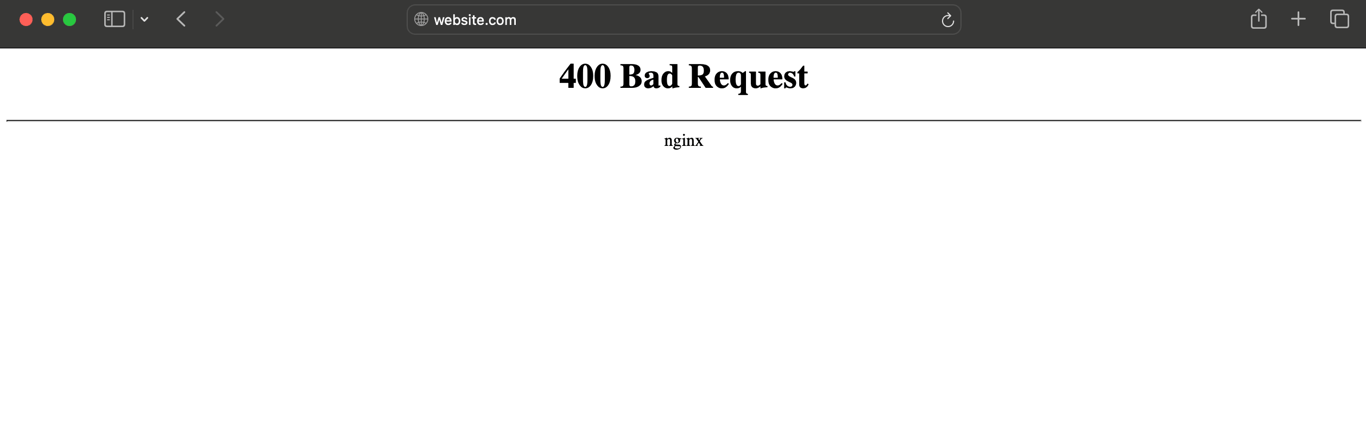
In Safari, the same error message shows up like:
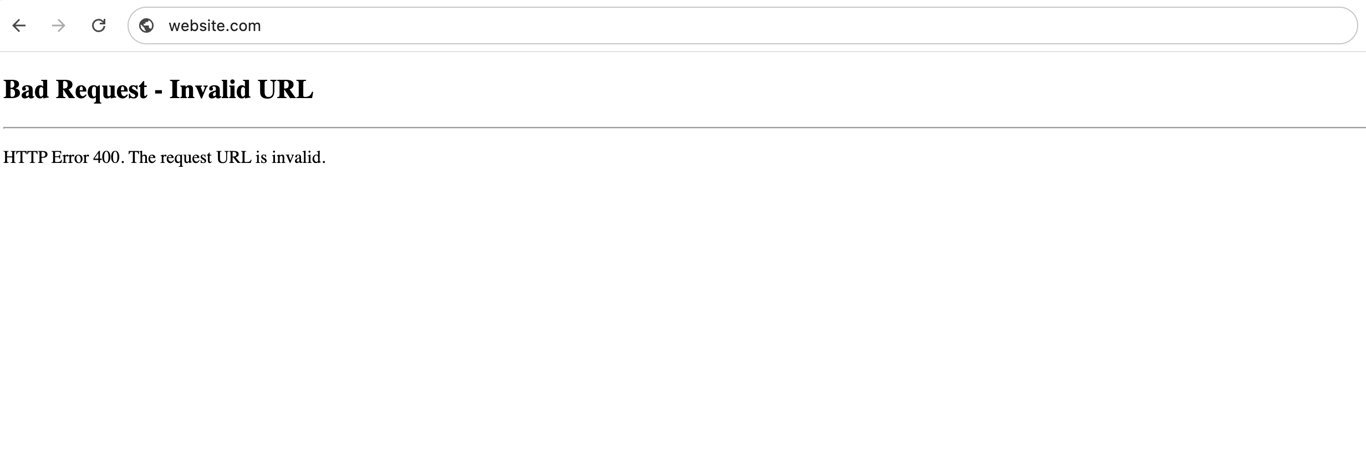
You may also come across different variations of the 400 status code that tell you what the problem might be.
For example, if the cookie data is larger than the allowed size limit, you will see a 400 error code saying Request Header Or Cookie Too Large.

Likewise, entering the wrong web address could trigger the Bad Request – Invalid URL error message.
Is a 400 Bad Request error a client-side or server-side issue?
A 400 Bad Request error is a client-side issue, which means the problem is with the request your browser sent, not the website’s server itself. The server is working fine and can likely handle other requests, but it just can’t process your specific one because something is wrong with how your browser formatted or sent it.
This is why most 400 errors can be fixed by making changes on your end rather than waiting for the website to fix anything.
How to fix a 400 Bad Request error
To fix a 400 Bad Request error, you’ll need to work through a few troubleshooting steps that target the most common causes.
According to research from Baymard, 13% of users leave a website when they encounter errors, but you don’t need to be one of them. Most 400 Bad Request errors can be solved with simple fixes that will get you to the content you’re trying to reach.
Here’s how to get rid of 400 Bad Request errors step by step:
1. Check your internet connection
When you attempt to access a website, your browser sends a request to the server, which then sends back a response.
A slow internet connection can cause the data to be transmitted incompletely, leading to the 400 status code.
So, before trying other troubleshooting methods, it’s a good idea to test your internet speed using a tool like Google Fiber.
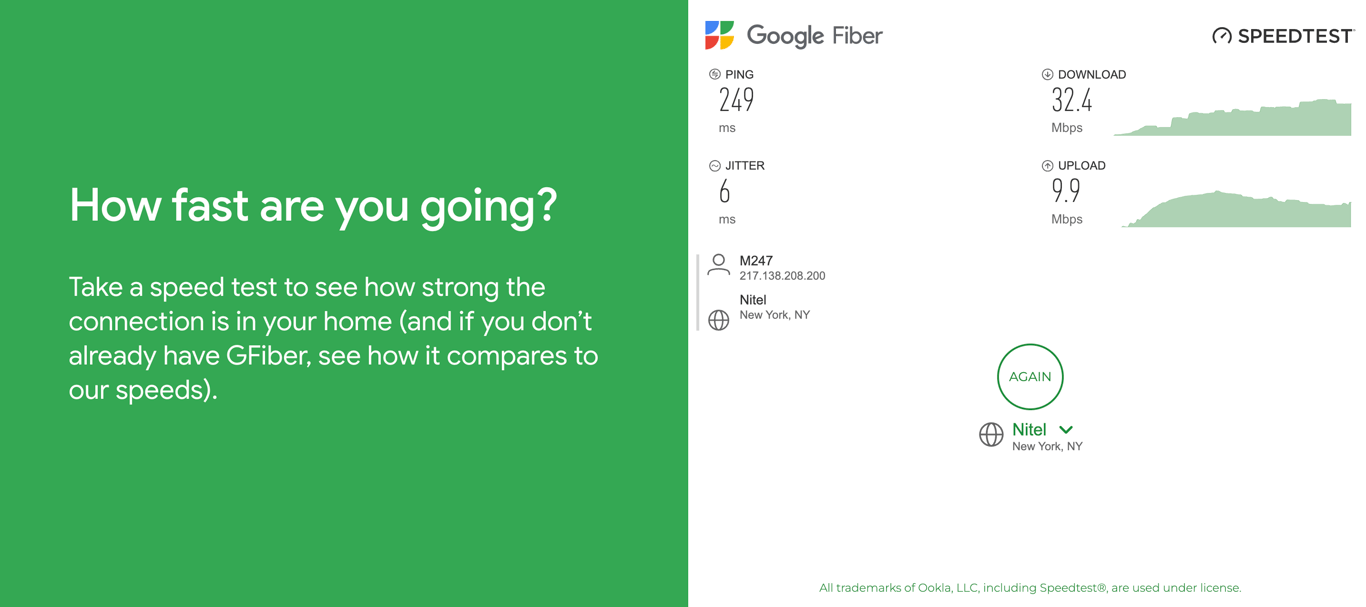
For web browsing, a good ping rate should be between 51 to 150 milliseconds (ms). Anything beyond that means your internet connection is slow. In that case, try using another network and see if the 400 error is solved.
If your connection works just fine, but the error remains, move on to the second step.
2. Fix typos and invalid characters in the URL
Every time you enter a URL in the address bar, check for spelling mistakes and incorrect use of special characters.
For instance, if you type www.hostinger.com/%tutorials in your browser, you will get this message:
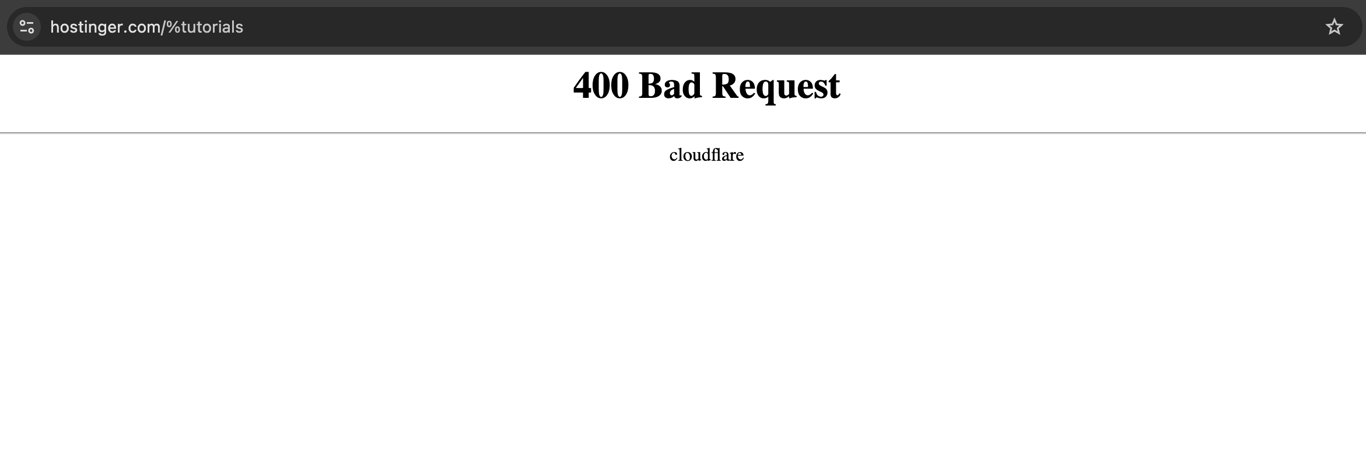
Why? Because this particular web address simply doesn’t exist. The correct URL is www.hostinger.com/tutorials.
Some URLs also use ASCII character encoding to transfer data on the internet. Common examples include replacing space with %20 and a colon (:) with %3A.
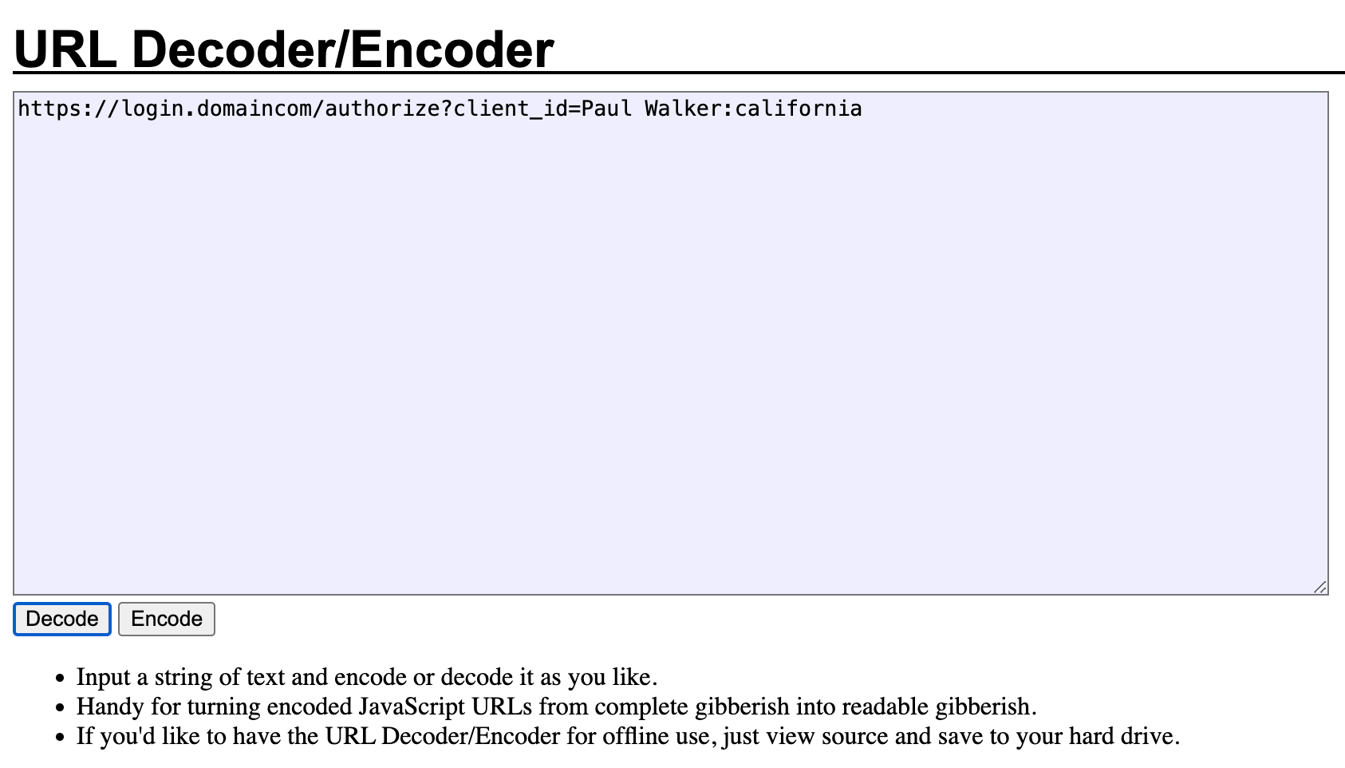
This is something you’ll see with long URLs that contain login details, like this:
https://login.domaincom/authorize?client_id=Paul%20Walker%3ACalifornia
However, improper encoding can lead to syntax errors. Since the encoded URL is so complicated, it’s easy to miss something, especially if you type it manually.
If you suspect that the URL you’re trying to reach is incorrectly encoded, use an encoder/decoder tool to decode the URL back to its original format.
After that, re-encode the URL following the proper syntax and format.
3. Clear your browser’s cache and cookies
Cache is temporary storage that keeps copies of web resources (like pages, images, and files) from websites you’ve recently visited. This allows your browser to load these resources faster on return visits instead of downloading them again
And then there are cookies. These are the small text files that websites store on your browser to remember information about your visit. They typically contain things like login session data, shopping cart contents, language preferences, and site settings. This allows websites to recognize you and maintain your preferences between visits.
For instance, you can easily open password-protected pages without having to enter your credentials each time.
But, there are always two sides to the same coin. As helpful as they are, cache and cookies can become corrupted or outdated. If the server is unable to find the correct information, it will show a 400 Bad Request error.
The easiest way to avoid this is to clear browsing data on a regular basis. If you’re a Google Chrome user, follow these steps:
- Click the three dots at the top right corner of Google Chrome and select Settings.
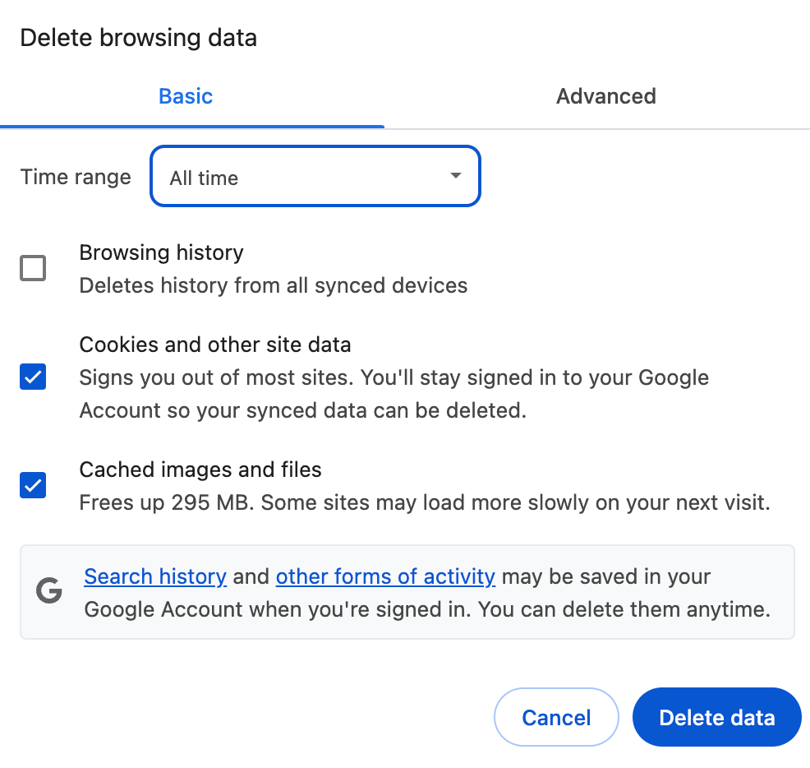
- Find the Privacy and security section and choose Delete browsing data.
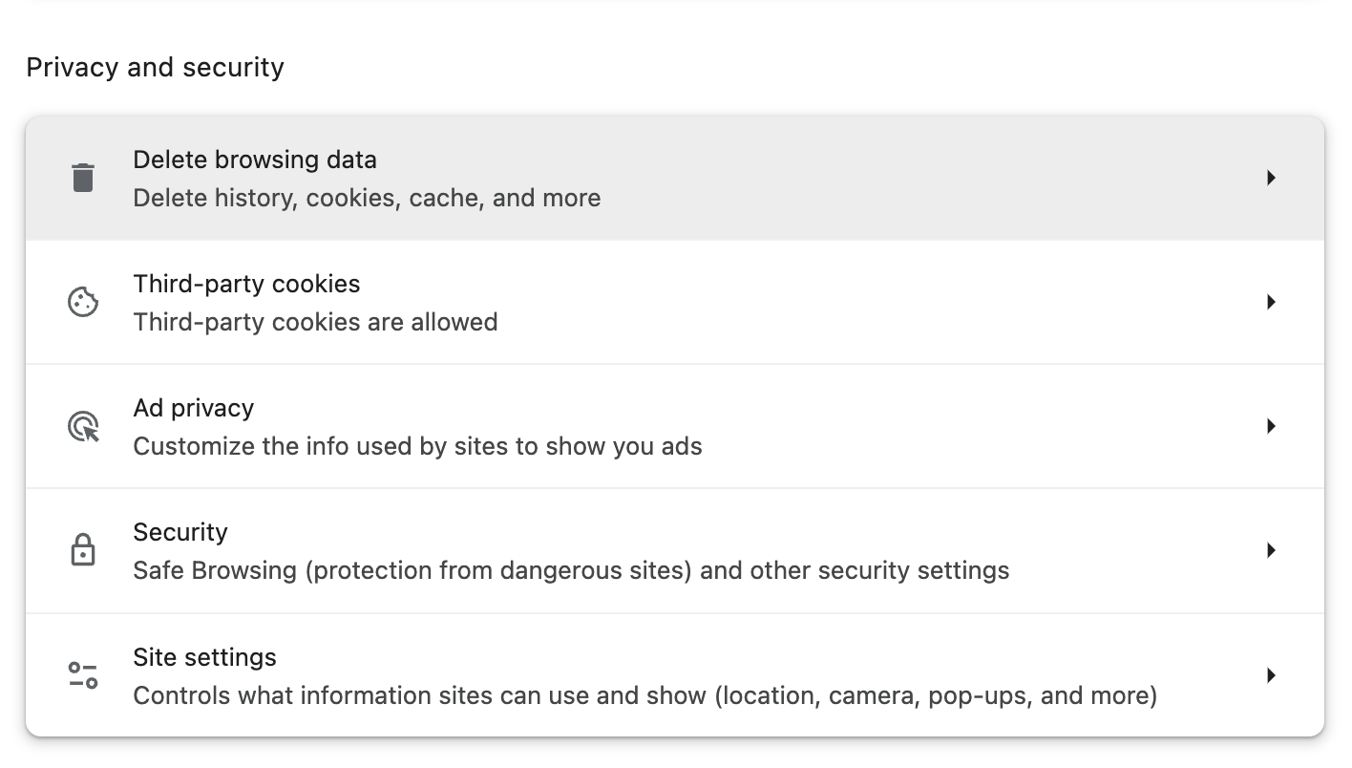
- Select Cached images and files and Cookies and other site data.
- Set your preferred time range – we recommend all time.
- Click Clear data, and that’s it.
The steps should be similar across different browsers. For more information, check out our guide on how to clear browser cache in Safari, Mozilla Firefox, and Microsoft Edge.
Keep in mind that deleting cache and cookies means you’ll be logged out of certain websites, depending on your chosen time range.
You may also experience a slower load time, since your browser has to redownload content that was previously stored in the cache.
4. Deactivate browser extensions
Some browser extensions interact directly with cookies, like password managers that store your login credentials, or ad blockers that keep a list of blocked domains and known ad scripts.
When your cookies are compromised, your extensions will send the wrong information to the server. Next thing you know, the server rejects your requests as it can’t find the missing data.
Many browser add-ons may also modify HTTP headers, block JavaScript scripts, and conflict with other extensions, all of which can trigger a 400 error.
Try disabling all your extensions temporarily to see if the error disappears. In Chrome, click the three-dot icon and select Extensions → Manage Extensions. Next, turn off the toggle switch of each extension.
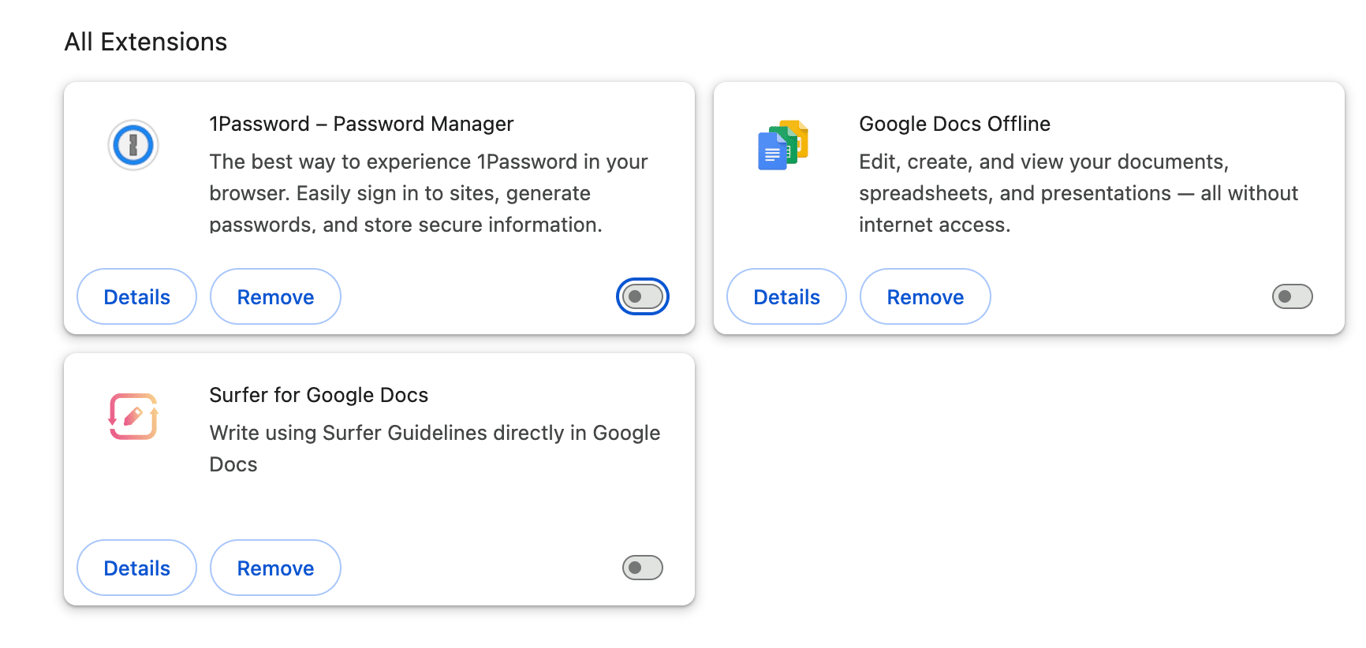
After that, refresh the web page that was displaying the 400 error. If the page loads correctly, this means one of the extensions was causing the problem.
Re-enable the extensions one by one, while refreshing the page after each activation. If the 400 error persists, the most recently enabled extension is likely responsible.
Try updating the suspect extension to see if this resolves the issue. If the extension is up to date, you may need to remove it and find a substitute.
5. Flush the DNS cache
The domain name system (DNS) stores the domain name and IP address of every website.
When you enter a domain name, your browser will look up the DNS servers to find the necessary IP address to load the web page.
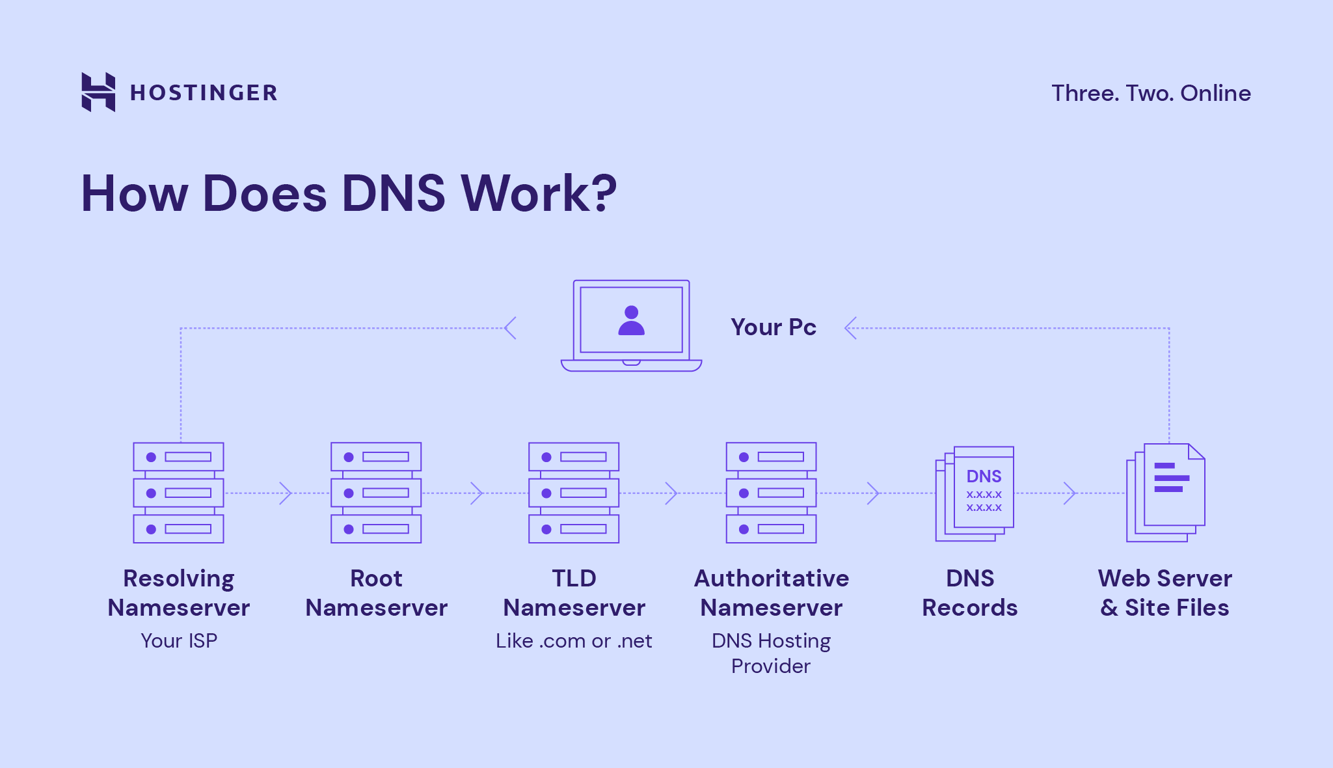
By default, these DNS records are stored in your computer’s local cache to speed up loading on repeat visits.
However, sometimes a website may change its IP address. When that happens, the cached data becomes outdated, resulting in the HTTP 400 error.
DNS records have built-in expiration times (TTL – Time To Live), so the cache updates automatically. However, when experiencing errors, you may want to clear it manually.
Here’s how to flush DNS cache on different operating systems:
Windows
The following DNS cache flushing method works on Windows 11, 10, 8, and 7:
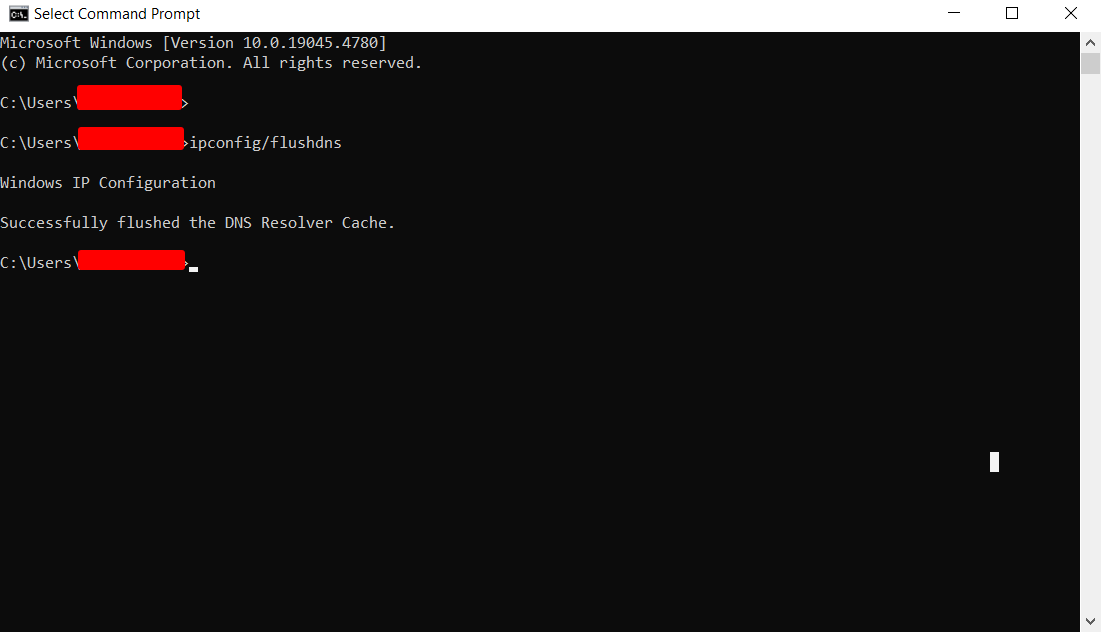
- Type in cmd in the Windows Search and press Enter to access the Windows command prompt console.
- Enter ipconfig /flushdns in the command prompt window and press Enter.
- A confirmation message should appear, indicating that the DNS resolver cache is successfully flushed.
macOS
Here’s how to flush the DNS cache on macOS 11 Big Sur or later versions:
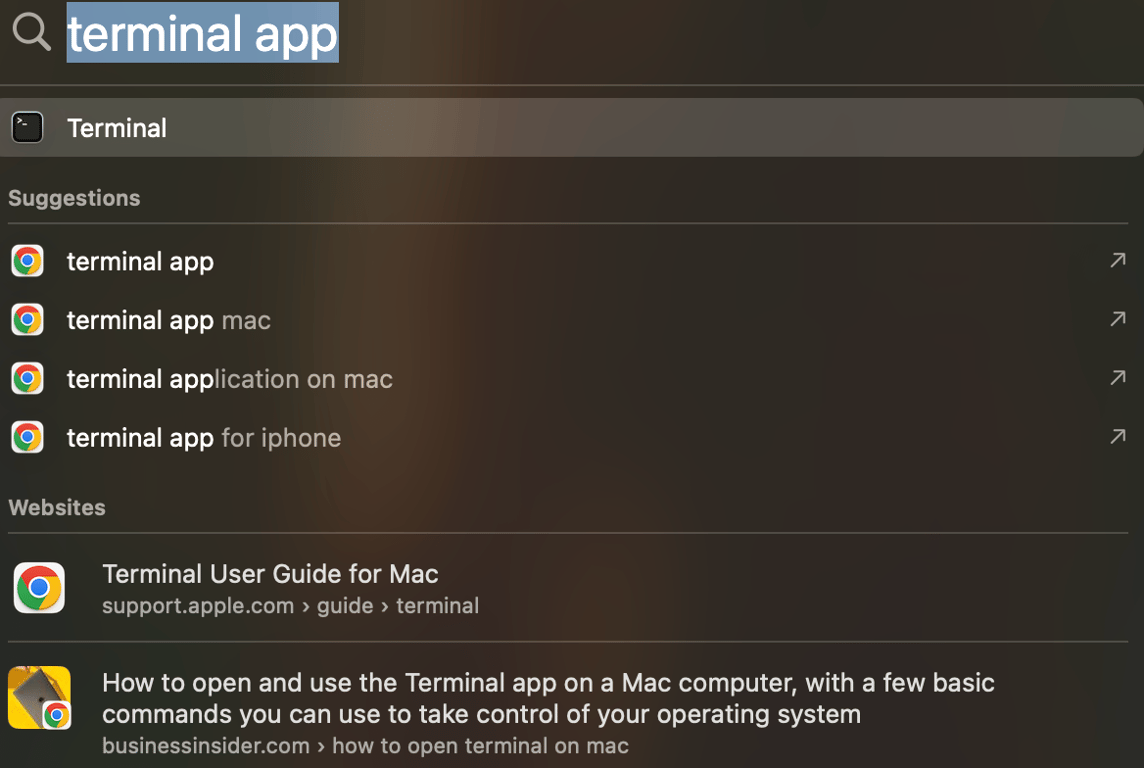
- Use the Spotlight search to find and access the Terminal app.
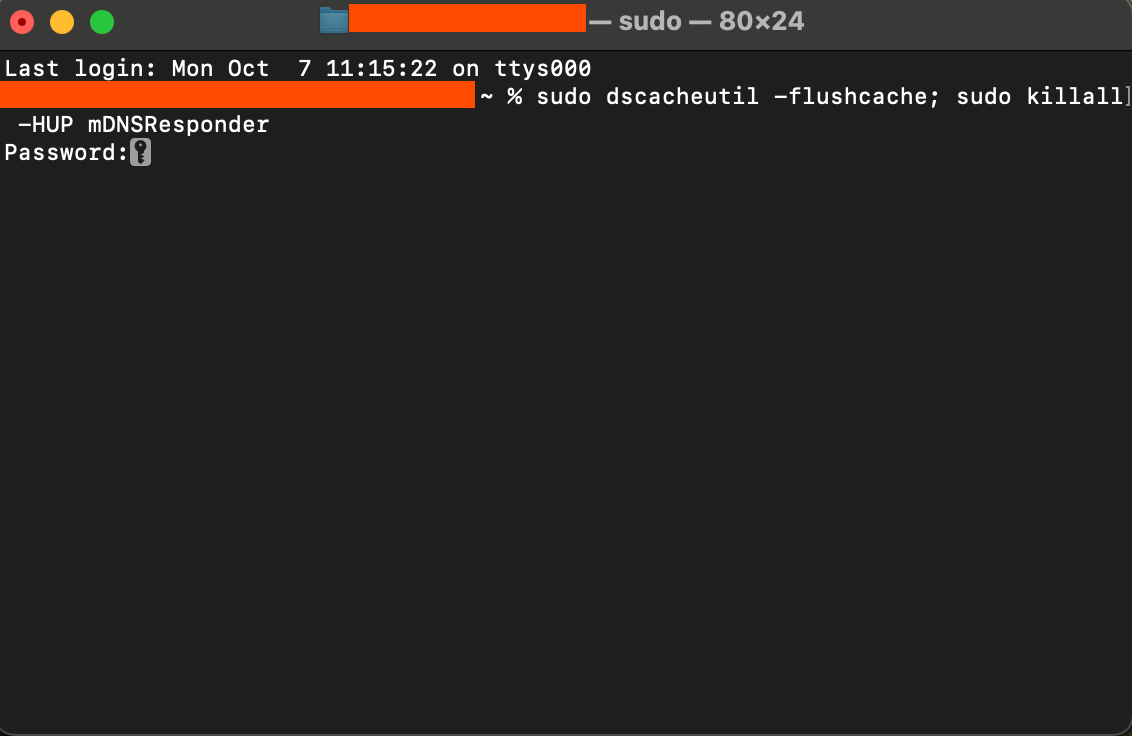
- Once opened, enter the following command and press Enter.
sudo dscacheutil -flushcache; sudo killall -HUP mDNSResponder
- Type in your administrator password when prompted. Note that it will not be visible as you type.
Older macOS versions may require different commands to flush the DNS cache.
If you’re running macOS Catalina, Mojave, High Sierra, Sierra, El Capitan, Mavericks, Mountain Lion, or Lion, try this command:
sudo killall -HUP mDNSResponder
For macOS 10.10 Yosemite, use this:
sudo discoveryutil udnsflushcaches
Besides your operating system, you have to remove the outdated DNS cache in your web browser.
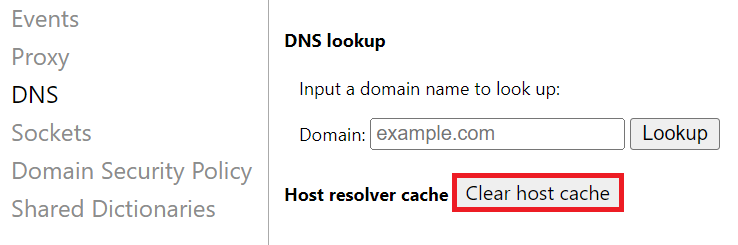
For Google Chrome users, simply type chrome://net-internals/#dns in the address bar and press Enter. Then, click Clear host cache to flush the DNS cache within Chrome.
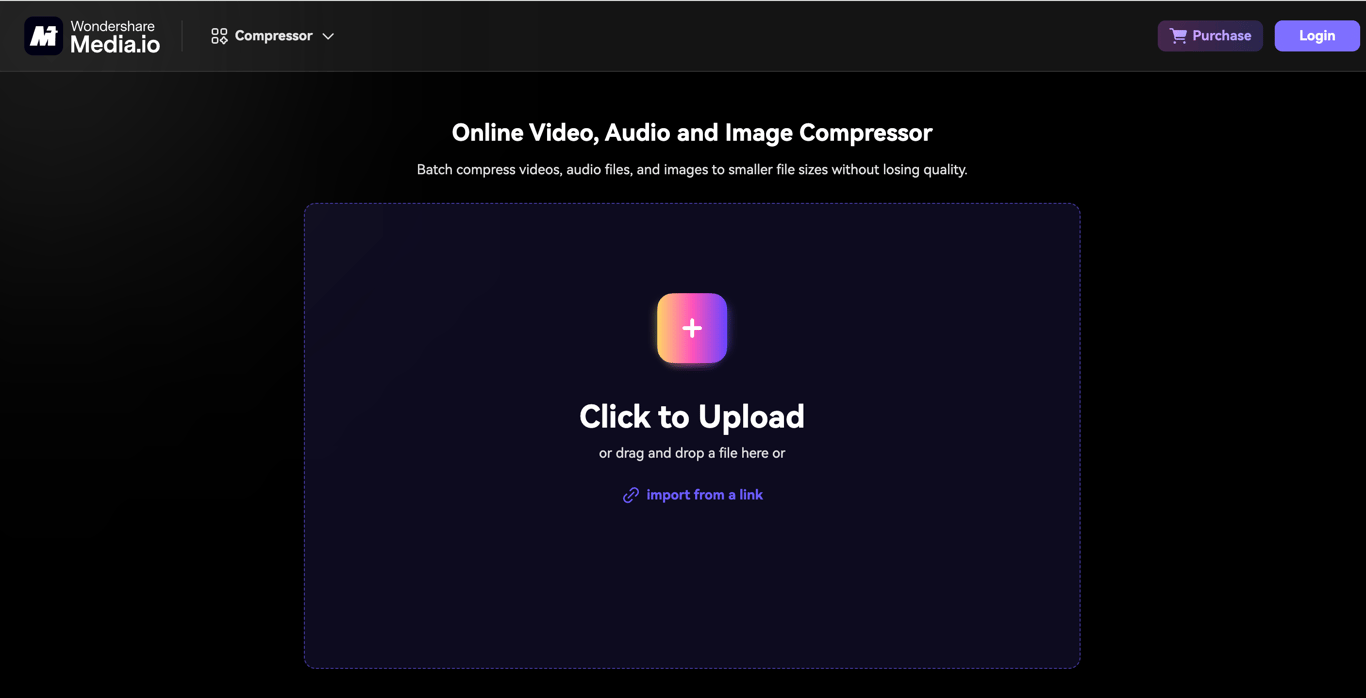
6. Compress your files
Web servers usually set an upload limit to preserve storage space and prevent timeouts. So, if you upload a file that’s larger than the allowed size, the server won’t be able to handle your request.
In that case, reduce your file size before trying to upload it again. There are tons of free online tools you can use:
Keep in mind that compressing a file may affect its quality. Always double-check your multimedia content to make sure it isn’t blurry after the compression.
How to fix 400 Bad Request on Google Chrome?
To fix a 400 Bad Request on Google Chrome, start by clearing your browser cache and cookies. Open the three-dot menu in the top right corner, go to More tools, then Clear browsing data, select All time as your time range, and click Clear data.
If that doesn’t work, try these Chrome-specific fixes:
- Disable extensions: Go to More tools, then Extensions, and turn off extensions one by one to identify the culprit.
- Try incognito mode: Open a new incognito window and test if the error still appears.
- Check for Chrome updates: Click the three-dot menu, go to Help, then About Google Chrome to update if needed.
You can also try the hard refresh shortcut to force Chrome to reload the page without using cached data.
How to audit your website for 4XX error codes
To audit your website for 4XX error codes, you’ll need to regularly check your site from both a user and technical perspective to catch these errors before they drive visitors away.
While manually browsing your website from different browsers can help you spot obvious issues, a comprehensive audit requires a more systematic approach.
You can use a tool like Ahrefs to perform a thorough site audit:
- Open Ahrefs and navigate to Site Audit.
- Click + New Project, then import your website from Google Search Console or add it manually.
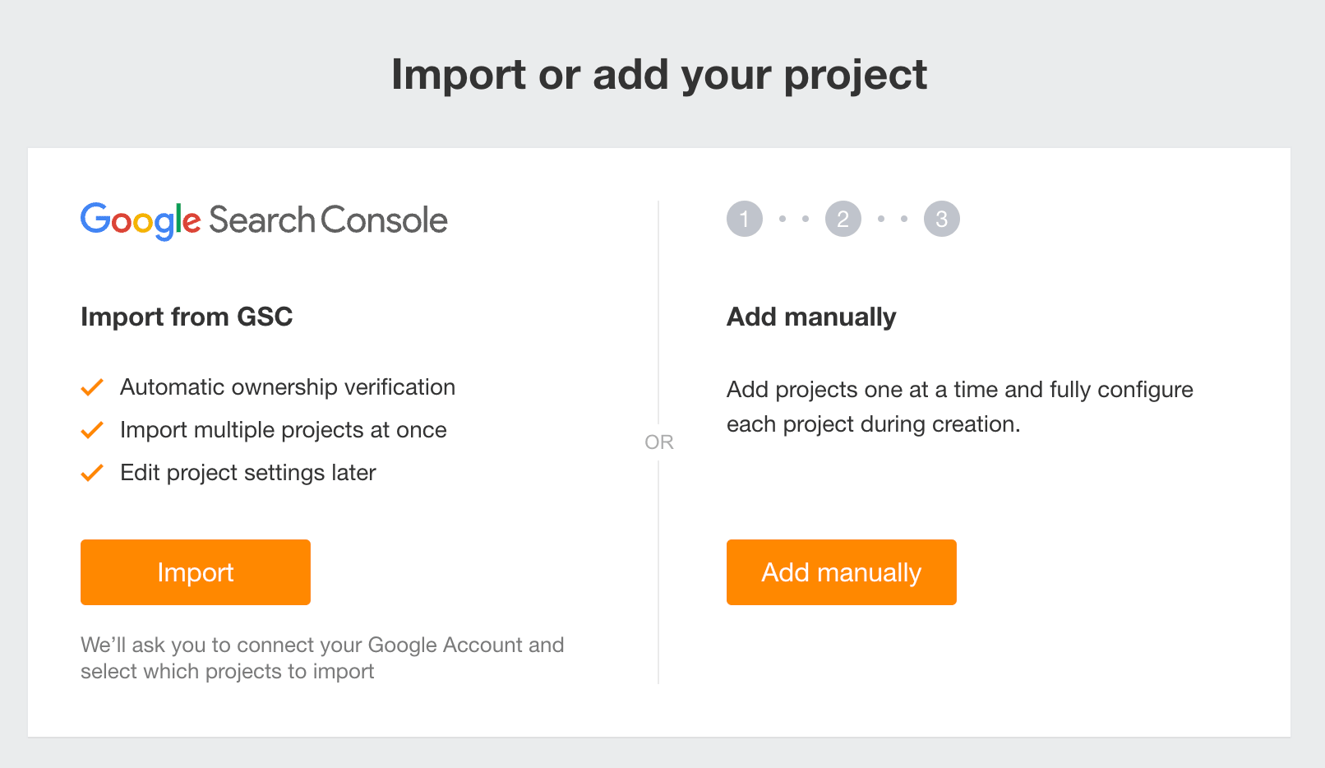
- Once added, trigger a new crawl and let Ahrefs analyze your site.
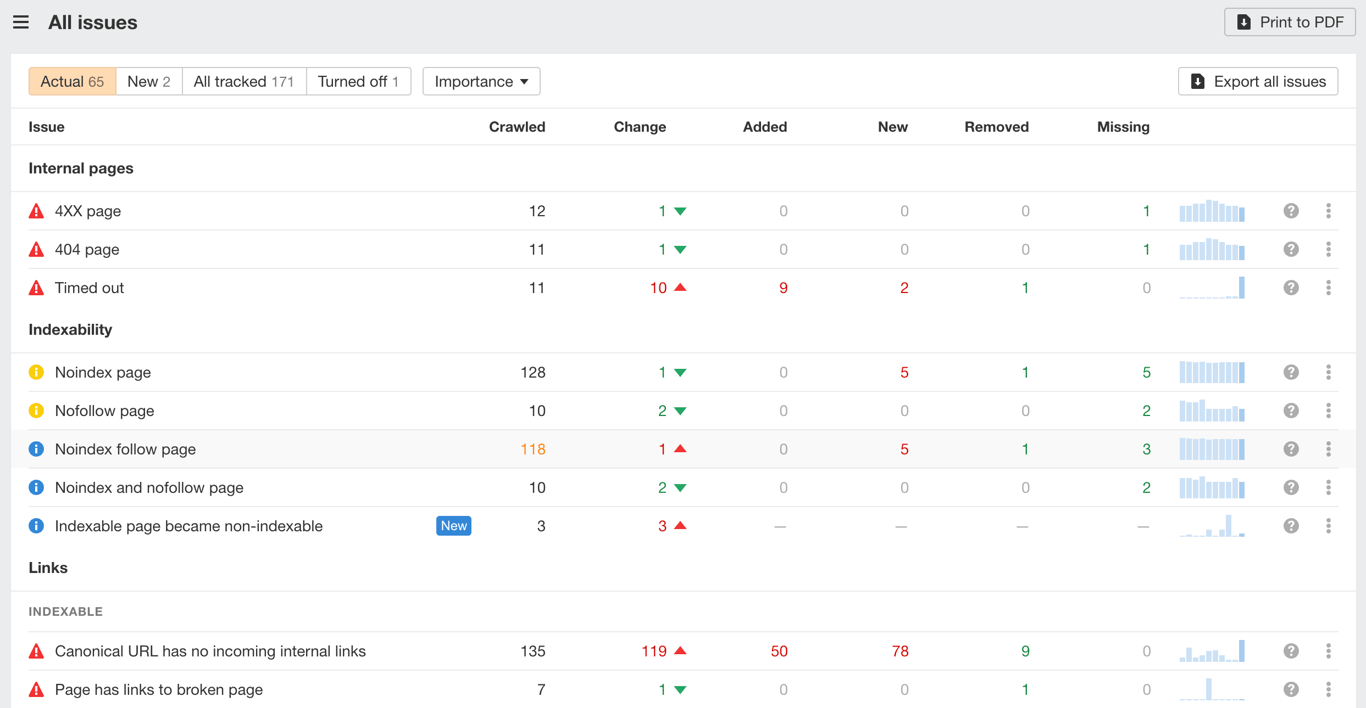
- After the report is finished, go to All issues from the left menu.
- Below Internal pages, you will see a list of 4XX errors within your site.
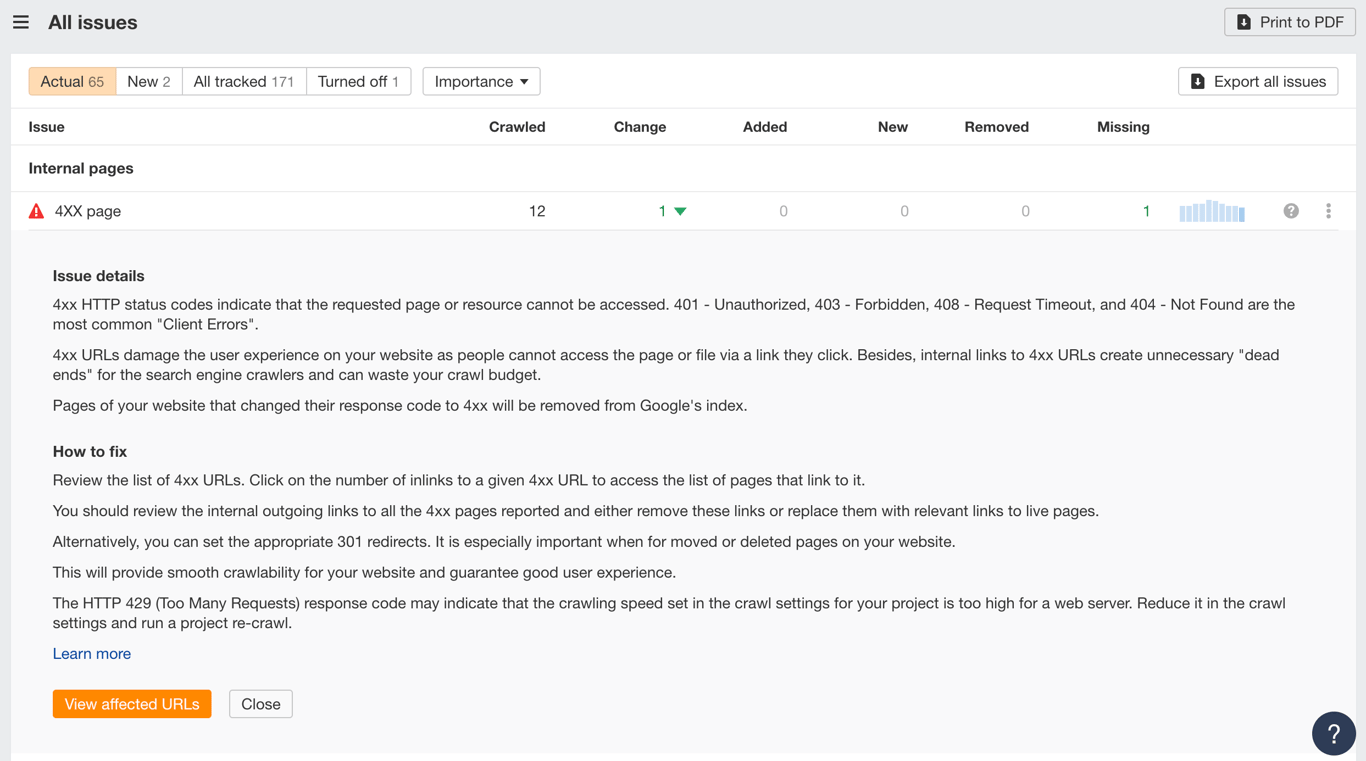
From there, click the question mark (?) button to learn more about the error details, such as which URLs are affected and the necessary steps to fix it.
Are there any tools that can help me debug a 400 Bad Request error?
There are several tools that can help you debug a 400 Bad Request error. These tools can give you more detailed information about what’s going wrong with your request.
Browser developer tools
Most browsers have built-in developer tools that show you exactly what’s happening when you encounter an error.
Press F12 in Chrome, Firefox, or Edge to open these tools. Go to the Network tab and reload the page. You’ll see all the requests your browser makes and can spot which one is returning the 400 error.
Online testing tools
- GTmetrix or Pingdom can test your website’s performance and identify errors from an external perspective.
- HTTP status code checkers let you test specific URLs to see what status codes they return.
Browser extensions
Extensions like HTTP Status Code or Link Checker can automatically scan pages for broken links and error codes as you browse.
WordPress debug mode
If you run a WordPress website, follow our guide to enable the WordPress debug mode. This feature provides detailed error messages that can help you identify plugins, themes, or code conflicts that might be causing 400 errors on your site.
These tools won’t fix the error for you, but they will help you understand exactly what’s causing it so you can apply the right solution.
All of the tutorial content on this website is subject to Hostinger's rigorous editorial standards and values.

Ariffud is a Technical Content Writer with an educational background in Informatics. He has extensive expertise in Linux and VPS, authoring over 200 articles on server management and web development. Follow him on LinkedIn.

Simon is a dynamic Content Writer who loves helping people transform their creative ideas into thriving businesses. With extensive marketing experience, he constantly strives to connect the right message with the right audience. In his spare time, Simon enjoys long runs, nurturing his chilli plants, and hiking through forests. Follow him on LinkedIn.