Cloudprober Explained: The Way We Use It at Hostinger

Cloudprober is software used to monitor the availability and performance of various components of a system. Here at Hostinger, we use it to monitor the load time of our customers’ websites. Initially, it began as a free open-source application by Google to help customers monitor their projects or infrastructures.
Cloudprober’s main task is to run probes, which are meant to investigate protocols such as HTTP, Ping, UDP, DNS to verify that the systems work as expected from the customer’s point of view. It’s even possible to have a specific custom probe (e.g. Redis or MySQL) via an external API. Hostinger focuses on the HTTP probe.
Probe Settings
Every probe is defined as the combination of these particular settings:
- Type – for example, HTTP, PING, or UDP.
- Name – each probe needs to have a unique name.
- Interval_msec – describes how often to run the probe (in milliseconds).
- Timeout_msec – probe timeout (in milliseconds).
- Targets – targets to run the probe against.
- Validator – probe validators.
- <type>_probe – the probe type-specific configuration.
Surfacers
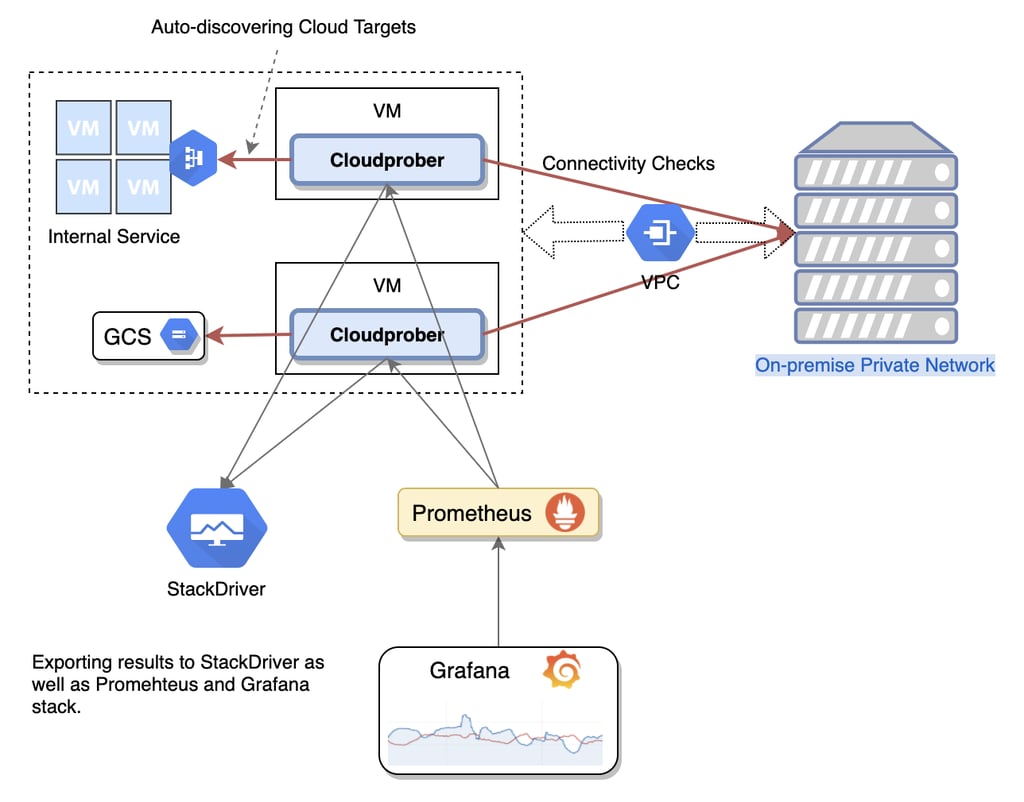
Surfacers are built-in mechanisms designed to export data to multiple monitoring systems. Multiple surfacers can be configured at the same time. Cloudprober mainly aims to run probes and build standard usable metrics based on the results of those probes. Thus, it provides a user-friendly interface that makes probe data available to systems that offer ways to quantify monitoring data.
Currently, Cloudprober supports the following surfacer types: Stackdriver (Google Cloud Monitoring), Prometheus, Cloudwatch (AWS Cloud Monitoring), Google Pub/Sub, File, and Postgres.
Validators
Cloudprober validators permit to run checks on probe request outputs if there are any. More than one validator can be configured, but all of them have to succeed for the probe to be marked as successful.
The Regex validator is the most common one, working with the majority of probe types. When you load the site and expect some string in it, the Regex Validator helps you make it dynamic.
The HTTP validator, which is only applicable for the HTTP probe type, helps to check the Header (success/fail) and Status code (success/fail).
Lastly, the Data integrity validator is mainly used for UDP or PINGS when we expect to see data in some repeating pattern (for example, 1,2,3,1,2,3,1,2,3 in the payload).
Targets Discovery
As it is cloud-based software, Cloudprober has support for targets auto-discovery. It is currently considered one of the most critical features – with it, Cloudprober can touch data from Kubernetes, Google Cloud Engine, AWS EC2, file discovery, and more. If that is not enough, it also has an internal discovery service, so you can integrate other discoveries into your infrastructure.
The core idea behind Clouprober’s targets discovery is using an independent source to clarify the targets that are supposed to be monitored. More information about the salient features of Cloudprober’s targets discovery can be found here.
Why Hostinger Chose Cloudprober
In October 2020, Hostinger was looking for an external monitoring system to gather uptime and speed statistics from all user websites. Consul (Blackbox consul website) was considered as one of the main ways to monitor sites. However, Cloudprober looked like a promising lightweight option that had Stackdriver integration, which allowed it to easily store logs, had no performance constraints, and could be accessed by the Data Team with no additional requirements.
Here are some factors as to why we have chosen Cloudprober as the preferred alternative:
- Headless and lightweight. Most alternatives we’ve looked at have a full solution regarding the custom problem they try to solve – web interface, user management, custom graphing, forced backed/database solution, etc. Cloudprober only does one thing – launches and measures probes. The workflow is designed to be simple and lightweight to keep resource usage low. Deployment is just one single statically linked binary (thanks to Golang).
- Compossible. Advantageous baked-in tools are included in this monitoring software. However, additional configurations can be initiated to do more.
- Extensible. The extensible nature of Cloudprober allows users to add features to the tool if required to better fit their individual needs. Also, extensive support documentation and a community of users is available.
- Live and maintainable. Before committing to a technology it is wise to determine whether its GitHub projects are still active. Another factor is determining how community-oriented it is, including metrics such as its issue and PR count, external contributors, and overall activity. Cloudprober passed all of these.
- Supports all modern ecosystems. Cloudprober, as the name would suggest, was designed for cloud native applications since day one. It can be run as a container (k8s), supports most public cloud providers for metadata and target discovery, and is easily integratable with modern toolings like Prometheus and Grafana. IPv6 is not a problem for Coudprober either.
Testing to Check if It Works for Hostinger
We tested Cloudprober thoroughly at Hostinger. To decide whether Cloudprober meets our needs, we checked the metric fidelity and possible setup/configuration scenarios for our scale.
We tried changing the Cloudprober code to add basic concurrency control. Different patterns were attempted to keep moderate load during latency measurement – a concurrency of 5+5 (HTTP+HTTPS). On largely loaded servers, it took approximately 30 minutes to crawl around 3,900 HTTPS sites, and approximately 70 minutes to do the same for around 7,100 HTTP sites.
The main challenge that we recognized was probe spreading – Cloudprober waits for a configured check interval and starts all the probes at the same time. We did not see it as a huge problem for Cloudprober itself as Consul, Prometheus, and Blackbox Exporter share the same feature, but this may have an impact on the whole hosting server.
Later on, Cloudprober was launched on approximately 1,8 million sites, and we found out that a GCP instance with 8 cores and 32GiB of RAM can handle it well (60% idle CPU).
How We Use Cloudprober at Hostinger
Here at Hostinger, HTTP metrics are pushed to PostgreSQL (technically, CloudSQL on GCP). Metric filtering is used and Cloudprober’s internal metrics are exported to the Prometheus surfacer. To check whether the sites are actually hosted with us, we send a specific header to every site and expect another header response.
Metric Output (Surfacers)
Initially, we thought that we would use a Prometheus surfacer. However, all collected metrics were around 1GB in size. This was too much for our Prometheus + M3DB system. While it’s possible to make it work, it’s not worth it. Therefore, we decided to move forward with PostgreSQL. We also evaluated Stackdriver, but PostgreSQL was a better fit for our tooling and purposes.
By default, the Cloudprober PostgreSQL surfacer expects this kind of table:
CREATE TABLE metrics (
  time TIMESTAMP WITH TIME ZONE,
  metric_name text NOT NULL,
  value DOUBLE PRECISION,
  labels jsonb,
  PRIMARY KEY (time, metric_name, labels)
);
There are a few drawbacks with this kind of storage:
- All labels are placed in the jsonb type.
- The jsonb type is not index-friendly nor easy to query.
- More data is stored than we need.
- All data is collected in one big table which is not easy to maintain.
- All data stored as strings which takes up lots of storage.
At first, we mangled all the inserts into a table. PostgreSQL (and many other RDMS) features a powerful technique – triggers. Another notable technique is called enums and it allows storing “string-like” data in a compact way (4 bytes per item). By combining these two with partitioning, we solved all of the drawbacks mentioned above.
We created two custom data types:
CREATE TYPE http_scheme AS ENUM (
  'http',
  'https'
);
CREATE TYPE metric_names AS ENUM (
'success',
'timeouts',
'latency',
'resp-code',
'total',
'validation_failure',
'external_ip',
'goroutines',
'hostname',
'uptime_msec',
'cpu_usage_msec',
'instance',
'instance_id',
'gc_time_msec',
'mem_stats_sys_bytes',
'instance_template',
'mallocs',
'frees',
'internal_ip',
'nic_0_ip',
'project',
'project_id',
'region',
'start_timestamp',
'version',
'machine_type',
'zone'
);We created a data insert function for the trigger:
CREATE OR REPLACE FUNCTION insert_fnc()
  RETURNS trigger AS
  $$
BEGIN

  IF new.labels->>'dst' IS NULL THEN
	RETURN NULL;
  END IF;

  new.scheme = new.labels->>'scheme';
  new.vhost = rtrim(new.labels->>'dst', '.');
  new.server = new.labels->>'server';

  IF new.labels ? 'code' THEN
	new.code = new.labels->>'code';
  END IF;

  new.labels = NULL;

  RETURN new;
END;
$$
LANGUAGE 'plpgsql';
And the main table:
CREATE TABLE metrics (
  time TIMESTAMP WITH TIME ZONE,
  metric_name metric_names NOT NULL,
  scheme http_scheme NOT NULL,
  vhost text NOT NULL,
  server text NOT NULL,
  value DOUBLE PRECISION,
  labels jsonb,
  code smallint
) PARTITION BY RANGE (time);
For partition creation, we can use the following script (creates partitions for next 28 days and attaches the trigger):
DO
$$
DECLARE
  f record;
  i interval := '1 day';
BEGIN
  FOR f IN SELECT t as int_start, t+i as int_end, to_char(t, '"y"YYYY"m"MM"d"DD') as table_name
	FROM generate_series (date_trunc('day', now() - interval '0 days'), now() + interval '28 days' , i) t
	LOOP
     RAISE notice 'table: % (from % to % [interval: %])', f.table_name, f.int_start, f.int_end, i;
	EXECUTE 'CREATE TABLE IF NOT EXISTS  m_' || f.table_name || ' PARTITION OF m FOR VALUES FROM (''' || f.int_start || ''') TO (''' || f.int_end || ''')';
	EXECUTE 'CREATE TRIGGER m_' || f.table_name || '_ins BEFORE INSERT ON m_' || f.table_name || ' FOR EACH ROW EXECUTE FUNCTION insert_fnc()';
  END LOOP;
END;
$$
LANGUAGE 'plpgsql';
We are currently in the process of automatically performing host monitoring by taking all host and website information from the Consul and using consul-template to generate a dynamic configuration.
We partition data by day for reason management and lockless operations. We also use PostgreSQL triggers and enums to filter, rewrite, and de-jsonb rows to save storage space (up to 10x savings) and speed things up. The Data Team imports such data from PostgreSQL into BigQuery and uses data mangling or modification to meet our needs.
How would the actual configuration look? The dynamic data from the consul-template is seen in the file path, and Cloudprober will re-read this file in 600 seconds, so one file with all the targets that have labels for the probe will be filtered out. Also, we use “allow_metrics_with_label” to expose different types of metrics to different surfacers. Prometheus – for Cloudprober itself, and PostgreSQL for probes. To save network bandwidth, we use the HTTP HEAD method. Not all our customers have up-to-date TLS certificates, so we have to skip validity checks for them.
Cloudprober.cfg:
disable_jitter: true

probe {
	name: "server1.hostinger.com-HTTP"
	type: HTTP

	targets {
  	rds_targets {
    	resource_path: "file:///tmp/targets.textpb"
    	filter {
      	key: "labels.probe",
      	value: "server1.hostinger.com-HTTP"
    	}
  	}
	}

	http_probe {
    	protocol: HTTP
    	port: 80
    	resolve_first: false
    	relative_url: "/"
    	method: HEAD
    	interval_between_targets_msec: 1000

    	tls_config {
     	disable_cert_validation: true
    	}

    	headers: {
      	name: "x-some-request-header"
      	value: "request-value"
    	}
	}

	additional_label {
    	key: "server"
    	value: "server1.hostinger.com"
	}

	additional_label {
    	key: "scheme"
    	value: "http"
	}

	interval_msec: 57600000
	timeout_msec: 10000

	validator {
  	name: "challenge-is-valid"
  	http_validator {
    	success_header: {
      	name: "x-some-response-header"
      	value: "header-value"
    	}
  	}
	}
}

surfacer {
	type: PROMETHEUS
	prometheus_surfacer {
    	metrics_buffer_size: 100000
    	metrics_prefix: "cloudprober_"
	}

	allow_metrics_with_label {
  	key: "ptype",
  	value: "sysvars",
	}
}

surfacer {
	type: POSTGRES
	postgres_surfacer {
  	connection_string: "postgresql://example:password@localhost/cloudprober?sslmode=disable"
  	metrics_table_name: "metrics"
  	metrics_buffer_size: 120000
   }

   allow_metrics_with_label {
  	key: "ptype",
  	value: "http",
   }
}

rds_server {
  provider {
	file_config {
  	file_path: "/tmp/targets.textpb"
  	re_eval_sec: 600
	}
  }
}
/tmp/targets.textpb example:
resource {
name: "hostinger.com."
labels {
	key: "probe"
	value: "server1.hostinger.com-HTTP"
  }
}
We only have a single request pending to meet our needs to use Cloudprober properly, and Cloudprober runs on a single instance of 8x 2.20GHz and 32 GiB RAM.
Sources For Further Interest
Interested in giving it a try and exploring Cloudprober’s possibilities? We recommend checking the following sites out:
- https://cloudprober.org/getting-started/
- https://opensource.googleblog.com/2018/03/cloudprober-open-source-black-box.html
- https://medium.com/dm03514-tech-blog/sre-availability-probing-101-using-googles-cloudprober-8c191173923c
Commits
- https://github.com/google/cloudprober/commit/3d5080b5dd0ee6a23395e6cf42a24c3e10557c2d
- https://github.com/google/cloudprober/commit/9f817036c98755d1f8da12b48b0ba00dbf331380
- https://github.com/google/cloudprober/commit/a1da1cd837b40598b3d9869b5ff2d8871ae38ea2
- https://github.com/google/cloudprober/commit/9674ae27076360098bc178330cc05191cb17ee89
- https://github.com/google/cloudprober/commit/0618ca6fe240a579400b153982fb383dc2df4dd6
- https://github.com/google/cloudprober/commit/a173510c80b854923366278d93fbc079c406e1fb
- https://github.com/google/cloudprober/commit/5aef6ad1aea957a01f6c690edde70a63136b3a6b
- https://github.com/google/cloudprober/commit/adab69a51b5059acd85e1f1940d7a3fc8a4b759b
- https://github.com/google/cloudprober/commit/684c9ce87416813cc523f07b7f9fb9a84abfc81e
This article was inspired by our R&D Engineer presentation on Cloudprober and its usage at Hostinger.

Ievas' powerful leadership skills enhance the strong brand name and image here at Hostinger. As Brand Communication Manager, she leads the team and continually monitors the delivery of brand direction as well as recommends areas of improvement so ensure we always stay on our A-game.