How to use the journalctl command to view Linux logs
Jul 04, 2025
/
Ariffud M.
/
9 min Read
The journalctl command is a powerful Linux utility for viewing, filtering, and managing system logs collected by systemd. It lets you inspect logs from services, users, or the kernel, troubleshoot boot errors, and monitor system activity in real time.
In this guide, you’ll learn how to use journalctl effectively – from basic syntax and command options to advanced filtering techniques. We’ll explain how to narrow down logs by time or source, customize log output formats, tail logs live, and manage storage with log rotation. You’ll also find practical command examples to help you analyze issues and maintain system performance directly from the command line.
What is the journalctl command?
journalctl is a Linux command-line tool that lets you view and analyze system logs collected by systemd. It serves as the main interface for querying the systemd journal, which stores logs in a binary format for fast access and advanced filtering.
Unlike traditional logging tools that store logs as plain text, the systemd journal keeps entries indexed and structured. This allows administrators to search logs by time, service, priority, or user with high speed and precision. As a result, journalctl is now the standard method for monitoring, troubleshooting, and auditing Linux systems using systemd.
journalctl command syntax
The basic syntax for the journalctl command is:
journalctl [OPTIONS] [FILTERS]
- [OPTIONS] – modify how journalctl behaves.
- [FILTERS] – narrow down your log search to specific results.
To display all logs, run:
journalctl
This command shows the entire system journal from the oldest entry to the newest:
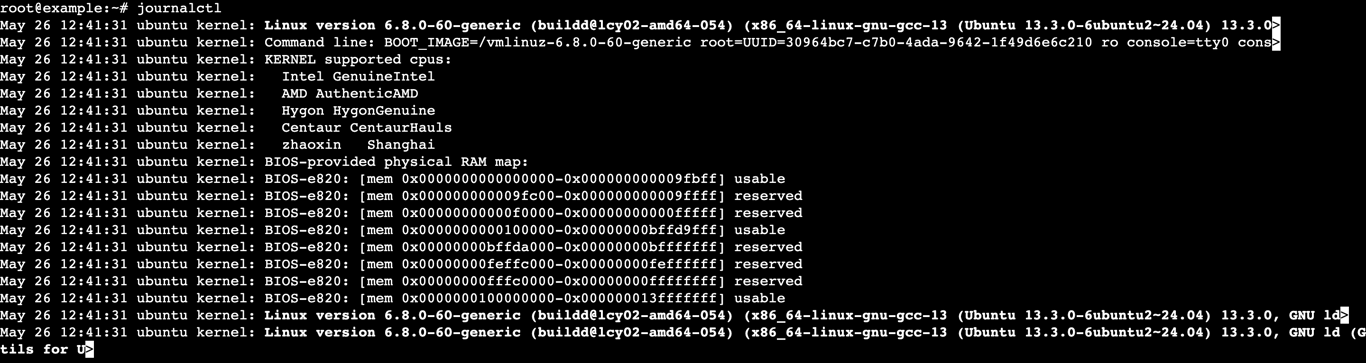
By default, pagination is enabled. You can scroll through the logs using the Up and Down arrow keys. To exit the log view, press q.
To disable pagination and print the full output directly in the terminal, add the –no-pager option:
journalctl --no-pager
This option lets you view all logs at once. Keep in mind that if your system has many logs, it will take a while to load everything.
📚 Suggested reading
journalctl is just one of many useful Linux commands. Check out our complete guide to learn the most essential commands, what they do, and how to use them.
journalctl options
Here are the most commonly used CLI options – also called flags or parameters – for journalctl:
- -p – displays journal logs with a specific priority level. Common levels include: emerg, alert, crit, err, warning, notice, info, and debug.
- –directory=PATH – specifies the directory that contains systemd journal files, such as /var/log/journal/1234567890abcdef.
- –file=PATH – opens a specific binary journal file, like /var/log/journal/1234567890abcdef/system.journal, to view its logs.
- –since=DATE – filters logs starting from the specified date. You can use an absolute date, like 2025-06-01, or a relative time, such as “yesterday” or 1 “hour ago”.
- –until=DATE – shows logs up to the specified date or relative time.
- –unit=UNIT – displays logs from a specific systemd unit, such as nginx.service.
- –grep=PATTERN – filters logs by a search pattern. For example, use –grep= “error” to show only error messages.
- –case-sensitive=BOOL – enables or disables case sensitivity for –grep. Use true to enable or false to disable. For instance: –grep= “Error” –case-sensitive=true.
- –output=STRING – sets the log output format. Supported values include: short, short-precise, short-iso, short-iso-precise, short-full, short-monotonic, short-unix, verbose, export, json, json-pretty, json-sse, json-seq, cat, and with-unit.
- -n INT – displays the last N log entries (positive number) or the first N (negative number), like 50 or -100.
- –reverse – reverses the output order to show the newest entries first.
- –show-cursor – shows the cursor position within the log stream.
- –utc – displays timestamps in Coordinated Universal Time (UTC).
- –no-pager – disables pagination to show all logs at once.
- –pager-end – starts the pager at the end of the logs.
- –interval=TIME – sets the interval between log queries. Examples include: 5s (five seconds), 6m (six minutes), and 1h (one hour).
- –disk-usage – shows the total disk space used by journal logs.
- –vacuum-size=BYTES – trims the journal to the specified size by deleting older logs. For instance: 1G, 256M.
- –vacuum-files=INT – limits the number of journal files to keep. For example, 5 holds the last five files.
- –vacuum-time=TIME – deletes logs older than the given time, such as 1week, 4days, or 7hours.
Some of these options require additional arguments to work. These arguments let you filter log results or customize the output format.
To see the full list of available options, use:
journalctl --help
You can also combine multiple options to tailor log queries to your needs. For example:
journalctl -u nginx.service -p err -n 50 --since=2025-06-01 --output=json-pretty
This command shows the last 50 error messages from the nginx.service unit, starting from June 1, 2025, in a readable JSON format.
How to use journalctl?
You can use journalctl to filter logs by time and source, customize the output format, tail and monitor logs in real time, and manage log data efficiently.
In the following sections, we’ll show you how to use the journalctl command for each of these tasks.
Filtering logs by time
To filter logs by time, use journalctl with the -b, –list-boots, –since, or –until options. Here’s how each one works:
Current boot
You can view logs from the current boot session by adding the -b option:
journalctl -b
Use this command to troubleshoot issues that occur right after a fresh start or to track system activity since the last reboot.
Previous boots
To view logs from a past boot, add the -b option with an offset. For example, use -b -1 to see logs from the previous boot:
journalctl -b -1
This command helps you track errors or unusual activity that happened after the last reboot.
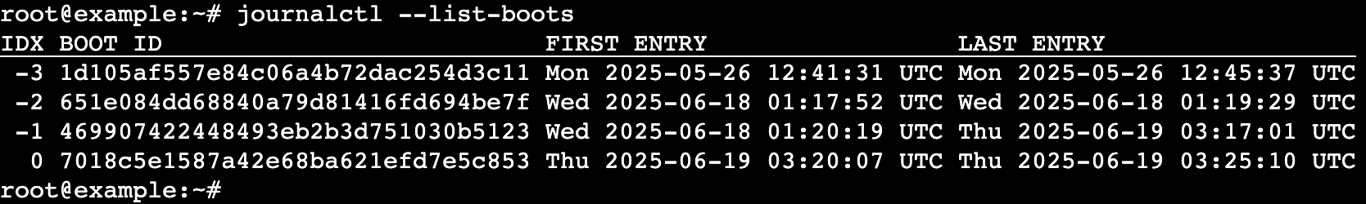
Meanwhile, to list all previous boot sessions, use:
journalctl --list-boots
It displays each boot session along with its timestamp, so you can easily choose which one to investigate.
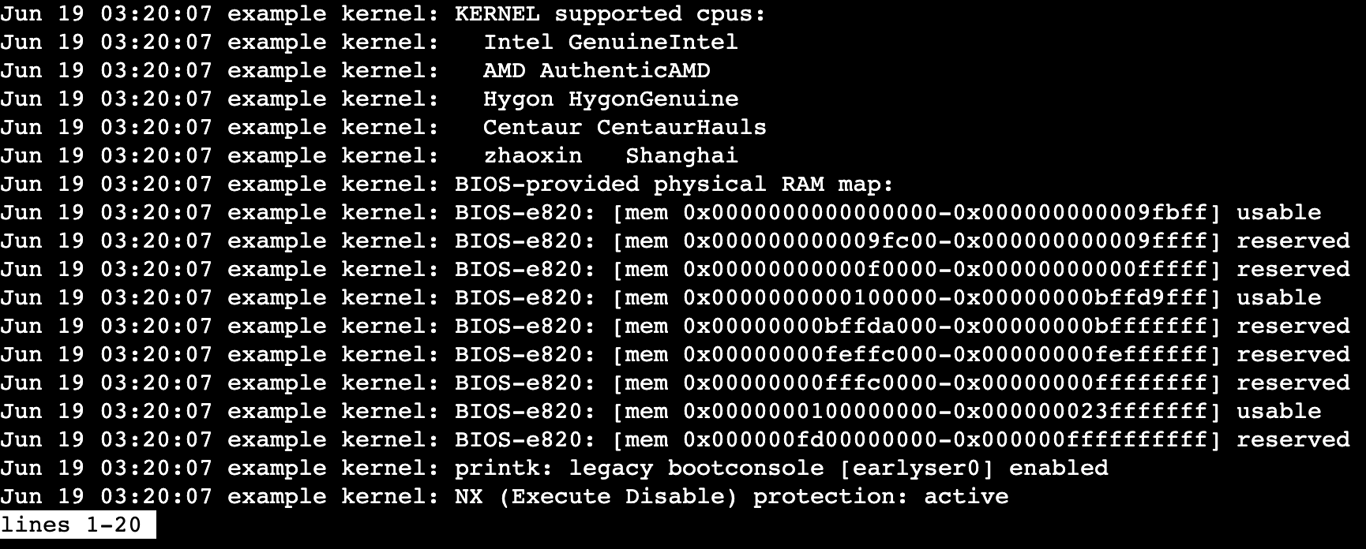
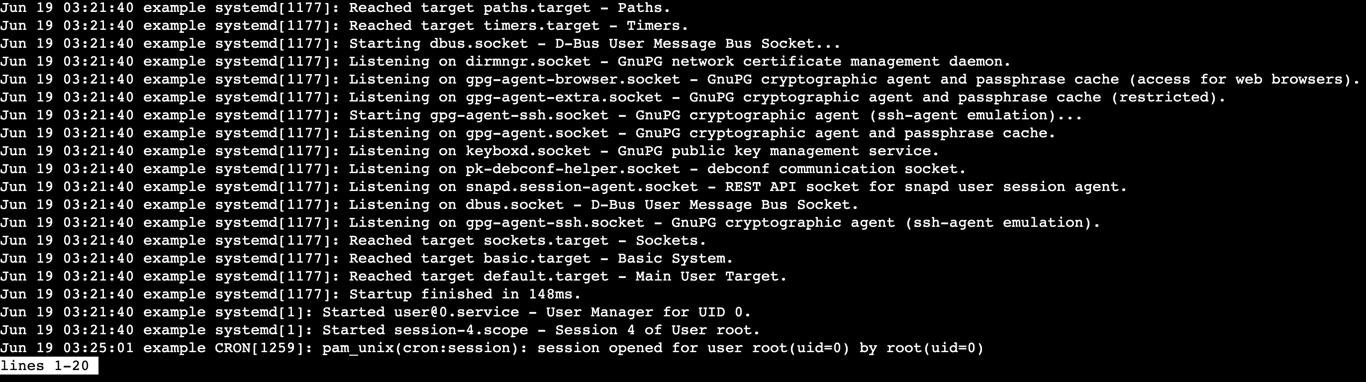
Time ranges
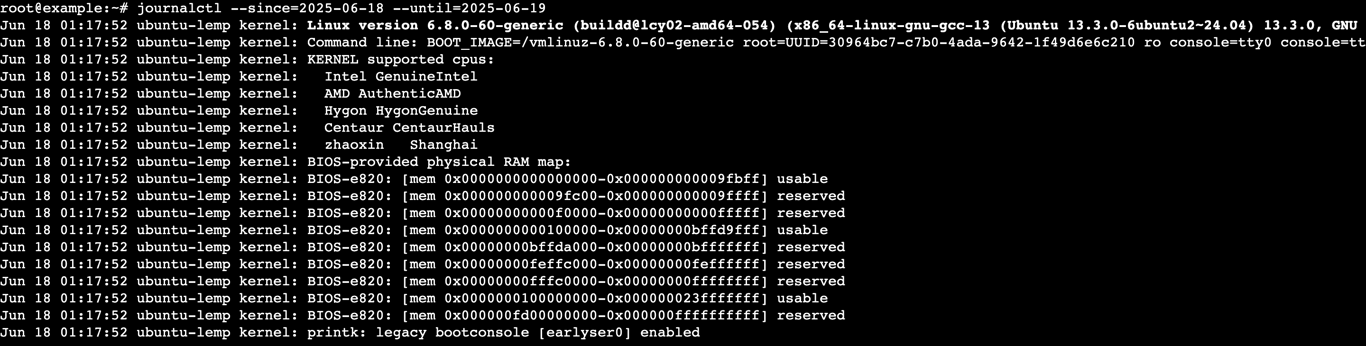
If you want to filter logs within a specific time frame, combine –since and –until in your journalctl command. For example:
journalctl --since=2025-06-18 --until=2025-06-19
This command shows logs between June 18 and June 19, 2025.
You can also use relative time, such as:
journalctl --since="1 hour ago"
Use these time filters to investigate issues that happened during a specific period – for example, after a system update or during a maintenance window.
Filtering logs by source
journalctl can filter logs by specific services, users, or the kernel. To do this, use the -u, _UID, _GID, _PID, or -k options.
By service or unit
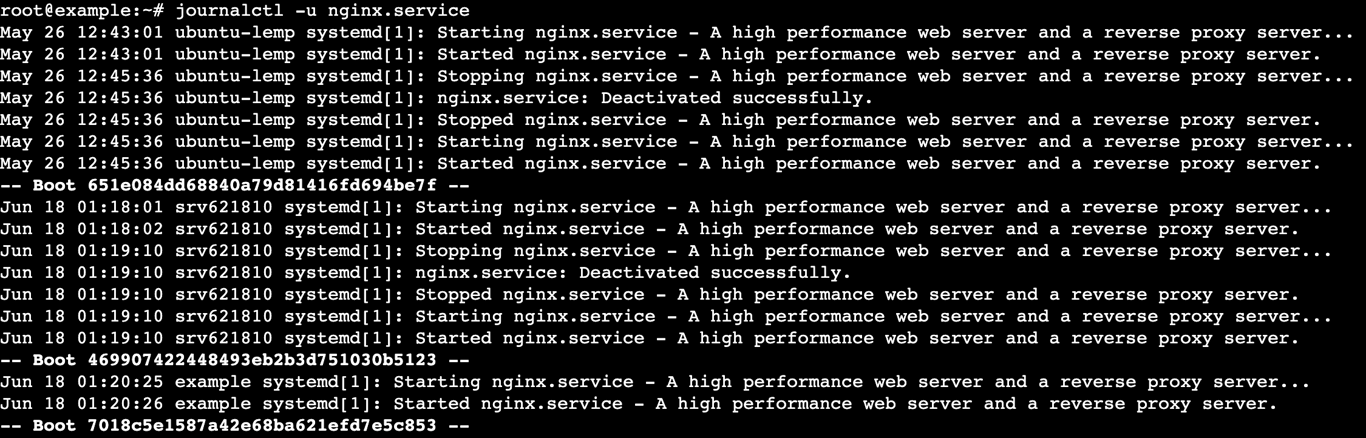
To view logs for a specific systemd unit, run journalctl with the -u option. Here’s an example of filtering logs for the NGINX service:
journalctl -u nginx.service
Use this command to diagnose errors, performance issues, or unexpected behavior in a particular service.
💡 Pro tip
If you don’t know the service name, you can list services in Linux using the systemctl list-units --type=service command.
By user ID, group ID, or PID
To filter logs by user, group, or process ID (PID), use the _UID, _GID, or _PID options.
For instance, to view logs for a specific user ID, run the journalctl command below:
journalctl _UID=0
It shows logs related to the user with ID 0.
Filtering logs by user ID is invaluable for troubleshooting issues related to user-specific activity or permission problems.
Kernel logs only
You can use journalctl to view kernel-related logs by adding the -k option:
journalctl -k
This command displays kernel logs, including hardware events, driver messages, and kernel panics.
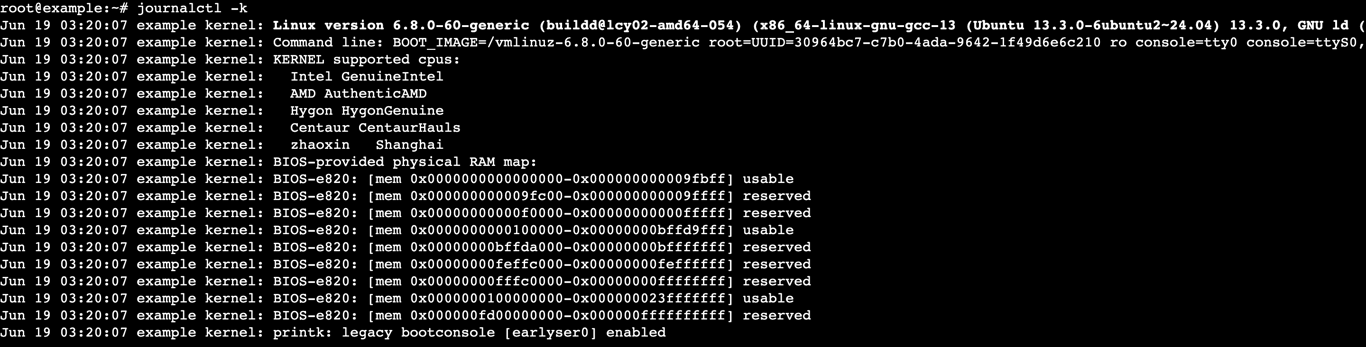
Use it when troubleshooting low-level system issues like hardware failures or system crashes.
Log output customization
journalctl offers several options, such as -o and –no-pager, to customize how it displays logs. Here’s how you can modify the log output to suit your needs:
Common output formats
Use the -o option to choose from different output formats. Here are some of the most commonly used:
- short – the default format, which shows concise and readable log entries.
- verbose – displays detailed log entries with extra context like timestamps, unit names, and metadata.
- json – outputs logs in JSON format, making it ideal for automation or log parsing.
- cat – prints raw log messages without any formatting, similar to the cat command.
- export – saves logs in a binary format so you can transfer them between systems or re-import them for analysis.
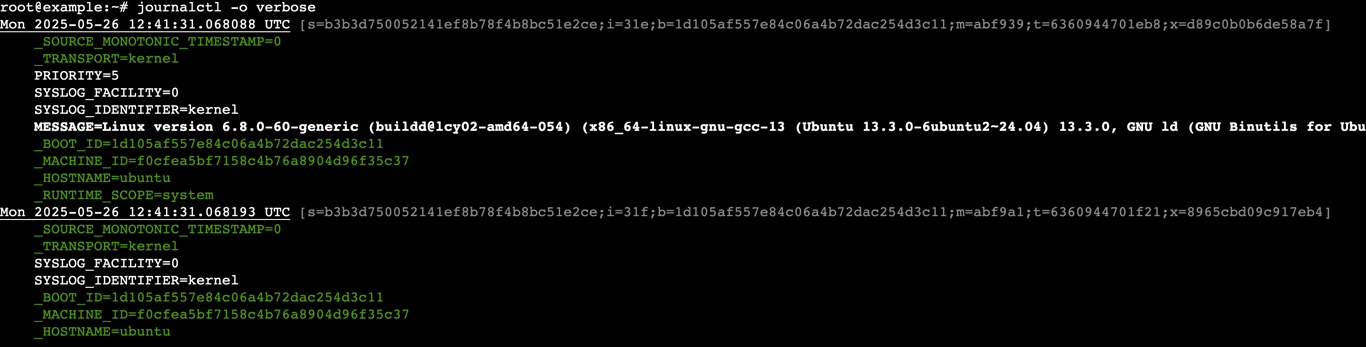
Printing full messages
To display complete, untruncated log entries, run:
journalctl -o verbose
This command gives you the full message content, which may be helpful when troubleshooting, as the default view cuts off important details.
Disabling pagination
As mentioned earlier, you can disable pagination using the –no-pager option:
journalctl --no-pager
This option is handy when you’re processing logs with other tools or redirecting output to a file, as it ensures a smooth, uninterrupted data flow.
For instance, to redirect the output to a file, use the > operator:
journalctl --no-pager > output.log
This journalctl command saves all output to a file named output.log.
Customizing output for automation
Customizing the output format is especially useful when integrating journalctl into scripts or automation tools.
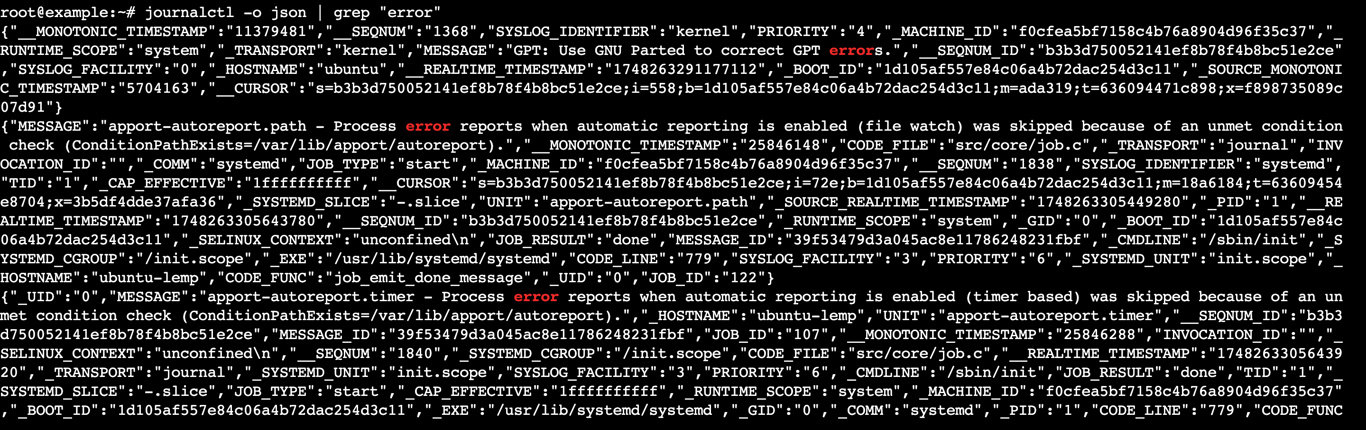
For example, you can format logs in JSON and pipe them into the grep command to extract specific entries:
journalctl -o json | grep "error"
This command outputs logs in JSON and then filters for entries that contain the word “error”.
Tail and monitor logs in real time
You can use journalctl to tail and monitor logs in real time. This is especially useful when you need to watch a service or track system activity as it happens.
Below are some common actions:
Tail log
To view the most recent log entries, use the -n option followed by the number of lines you want to display. For example:
journalctl -n 50
This command shows the last 50 log entries. It’s useful for a quick look at recent system activity without waiting for new entries.
Follow log entries
If you want journalctl to continuously display new log entries as they appear, use the -f option:
journalctl -f
To stop journalctl from displaying new entries, hit Ctrl + C.
It works like the tail -f command, showing logs in real time as the system or services generate them.
Real-time monitoring for specific services
You can combine -f with filters to monitor specific services. For instance, to follow real-time logs from the NGINX service, run:
journalctl -u nginx.service -f
Use this command to monitor services like NGINX or SSH and track live performance, error messages, or other important events as they occur.

Manage journalctl logs
journalctl provides several ways to manage log storage, rotate logs, and control how long logs are retained.
These practices help reduce disk usage and keep your system efficient, especially since logs can quickly consume significant space.
Log rotation and space control
journalctl automatically handles log rotation, but you can manually configure limits to control storage usage and the number of retained log files.
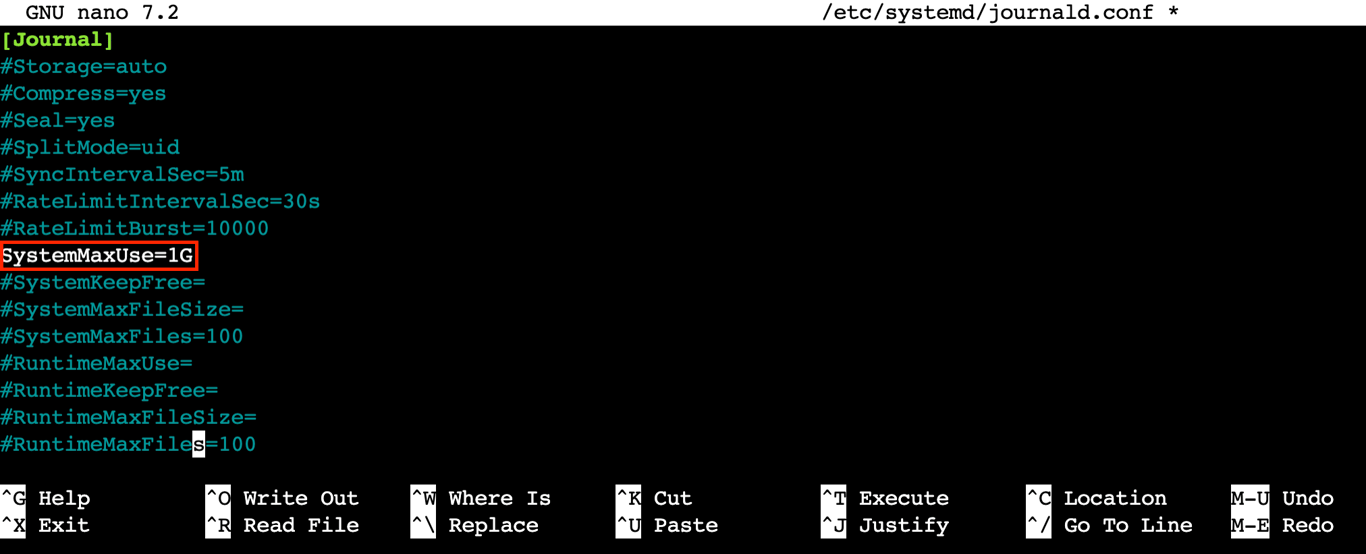
To do this, open the journald.conf file with the nano text editor:
sudo nano /etc/systemd/journald.conf
Use parameters such as SystemMaxUse, RuntimeMaxUse, and MaxFileSec to set limits on log size and retention time. For example, to limit logs to one gigabyte, uncomment the line and add a value like:
SystemMaxUse=1G
After editing the file, save and exit by pressing Ctrl + X → Y → Enter.
Persistent logs
By default, journalctl stores logs persistently, so they can survive across system reboots. To confirm or change this behavior, open the same journald.conf file.
Then, look for the Storage setting. If it’s set to auto, systemd writes logs to disk if the persistent storage directory (/var/log/journal/) exists.
To force persistent logging, uncomment the line and set the value to:
Storage=persistent
If you want to store logs only in memory during the current boot session, use:
Storage=volatile
Manually delete logs
If logs exceed your configured limits or you want to clean up space manually, use the –vacuum options:
- Vacuum by size – delete logs until total disk usage drops below the specified limit:
journalctl --vacuum-size=1G
- Vacuum by time – remove logs older than a specific duration:
journalctl --vacuum-time=1week
- Vacuum by file count – keep only the most recent log files:
journalctl --vacuum-files=5
Additionally, to check how much space journal logs are currently using, run:
journalctl --disk-usage

journalctl examples
Below are some real-world journalctl command examples to help you troubleshoot common system issues and better understand how to apply different filters and options.
Troubleshoot a service failure
- Task: Investigate why the NGINX service failed to start after a reboot.
journalctl -u nginx.service --since="2025-06-01 01:00:00" --until="2025-06-01 02:00:00"
This command filters logs for the nginx.service unit on June 1, 2025, between 1:00 AM and 2:00 AM. Use it to pinpoint when and why the issue occurred.
Real-time log monitoring for SSH brute-force attacks
- Task: Monitor the SSH service for signs of a brute-force attack, such as repeated failed login attempts.
journalctl -u ssh.service -f | grep "Failed password"
It combines journalctl -f with grep to actively monitor SSH logs in real time, filtering for entries that contain “Failed password.”
Check logs after a system crash for hardware issues
- Task: Review kernel logs after a system crash to identify possible causes.
journalctl -k --since=2025-06-01 --until=2025-06-02
This command displays kernel logs between June 1 and June 2, 2025. Use it to search for hardware failures or kernel panics around the time of the crash.
Export logs for forensic analysis
- Task: Export system logs to a file for review after a potential security breach.
journalctl --since=2025-06-01 --until=2025-06-10 > system_logs_2025-06-01_to_06-10.log
It exports logs from June 1 to June 10, 2025, into a file named system_logs_2025-06-01_to_06-10.log for further analysis or auditing.
Track system errors during an update process
- Task: Investigate unexpected behavior after a system update by checking error logs during the update window.
journalctl --since="2025-06-01 01:00:00" --until="2025-06-01 03:00:00" -p err
This command filters logs between 1:00 AM and 3:00 AM on June 1, 2025, and shows only error-level entries (-p err) to help you diagnose what went wrong.
Key takeaways on using journalctl
journalctl is a critical command-line tool for managing system logs on Linux, offering detailed filtering, real-time monitoring, and customizable outputs. Whether you’re diagnosing a failed service or tracking kernel-level events, knowing how to use its options effectively helps you act faster and with greater precision.
For VPS users, mastering journalctl provides direct insight into your server’s behavior, making it easier to resolve issues, optimize performance, and maintain uptime. As a next step, explore related tools like systemctl for managing services, or check out our tutorials on log rotation and Linux security best practices to deepen your knowledge.
All of the tutorial content on this website is subject to Hostinger's rigorous editorial standards and values.

Ariffud is a Technical Content Writer with an educational background in Informatics. He has extensive expertise in Linux and VPS, authoring over 200 articles on server management and web development. Follow him on LinkedIn.