Aug 26, 2025
Prasasti P. & Ariffud M.
8min Read
The traceroute command is a network diagnostic tool that shows where connection problems occur. It works by mapping the path your data packets take from your computer to a destination server, displaying each “hop” along the way.
Traceroute is especially useful when your internet connection feels slow or a website won’t load.
Keep reading to learn how to use traceroute on macOS, Linux, and Windows. We’ll also explain how to read the output to identify common network issues like high latency and packet loss, so you can pinpoint the source of connection problems.
The traceroute command maps the path data packets take from a source computer to a destination server. It reveals every step, or “hop,” of the journey, making it essential for network troubleshooting.
The command works on most operating systems, though its name varies: Linux and macOS use traceroute, while Windows uses tracert.
Here’s a simple breakdown of how it works:
This step-by-step mapping is what separates traceroute from the simpler ping command.
In short, ping tells you if you can reach a server and measures the total round-trip time, while traceroute shows you how you get there and pinpoints where any delays are happening along the way.
You should use the traceroute command to diagnose network performance issues and pinpoint the exact location of connection slowdowns or failures.
It helps you determine whether a connectivity problem lies within your local network, with your internet service provider (ISP), or on the destination server’s network.
The main situations where running a traceroute is useful are below:
For example, if the results show a long delay immediately after your home router, the issue is likely with your ISP.
Now that you understand what traceroute does and when to use it, let’s look at how to run the command on your operating system.
Running a traceroute is simple using your system’s built-in command-line application, such as Terminal or Command Prompt.
While the core function is the same, the exact steps and command name differ slightly depending on whether you are using macOS, Linux, or Windows.
Below, we’ll walk through the specific instructions for each operating system.
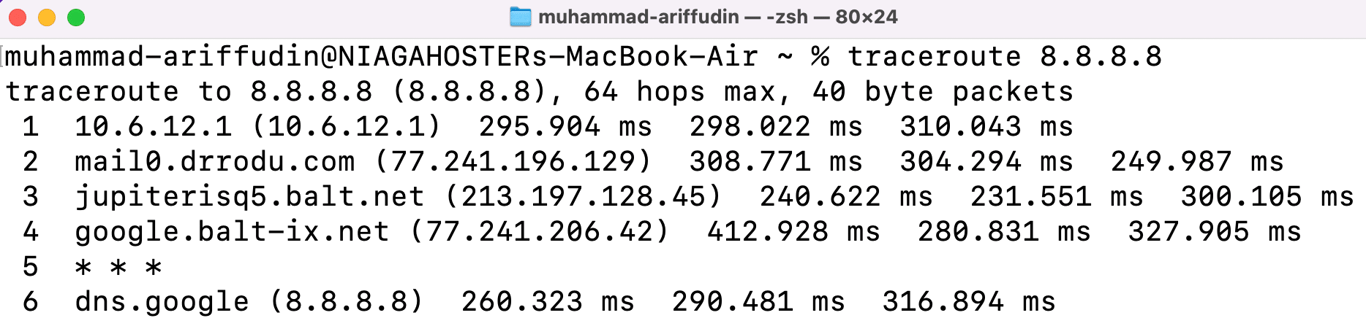
On macOS, the standard way to run a traceroute is by using the built-in Terminal application. Here’s how to do it:
traceroute 8.8.8.8
The output will immediately begin to populate in the Terminal, showing each hop of the connection’s path.
For more specific diagnostics, you can add flags to the command. Here are some of the most commonly used ones:
| Flag | Description |
| -I | Uses ICMP packets instead of the default UDP. This is useful if a firewall is blocking UDP traffic. |
| -n | Shows only IP addresses instead of resolving hostnames. This can significantly speed up the trace. |
| -q <number> | Sets the number of probe packets sent to each hop (default is 3). traceroute -q 1 is faster. |
| -m <number> | Sets the maximum number of hops (max time-to-live) for the trace. The default is usually 64. |
| -w <number> | Sets the time in seconds to wait for a response from a probe (default is 5). |
| -p <port> | Specifies the destination port to use for the trace. |
Since macOS and Linux are both UNIX-based operating systems, the process for running traceroute and the available options are nearly identical. Let’s cover the steps for Linux next.
For Linux users, you can run a traceroute through the Terminal. The traceroute command comes pre-installed on most Linux distributions.
If the command isn’t found, you can easily install it using your system’s package manager.
sudo apt update && sudo apt install traceroute
sudo dnf install traceroute
Here’s the simplest way to run a trace:
traceroute hostinger.com
The Terminal will then display the route, listing each hop it takes to reach the destination server.
By default, the Linux traceroute command sends UDP packets. If you need to send ICMP packets instead – which is how the Windows tracert utility works – you can use the -I flag:
traceroute -I hostinger.com
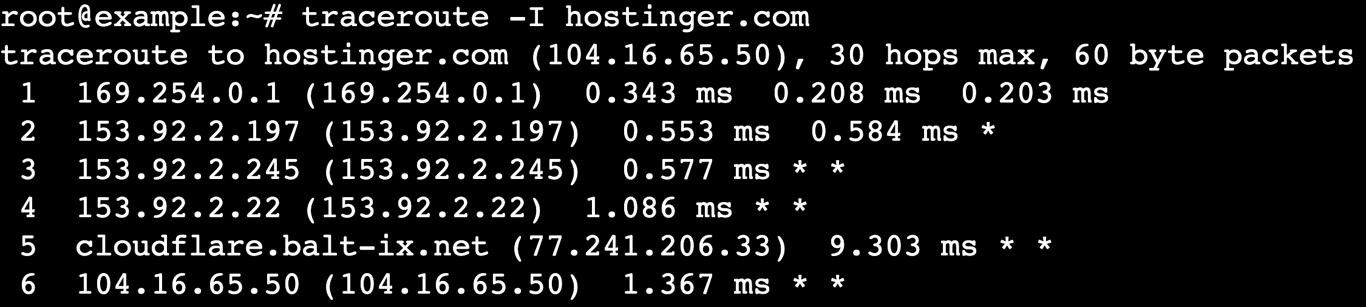
This is a useful option for troubleshooting networks that may handle UDP and ICMP traffic differently.
Now, let’s look at how to perform the same task on Windows, which uses a slightly different command and protocol.
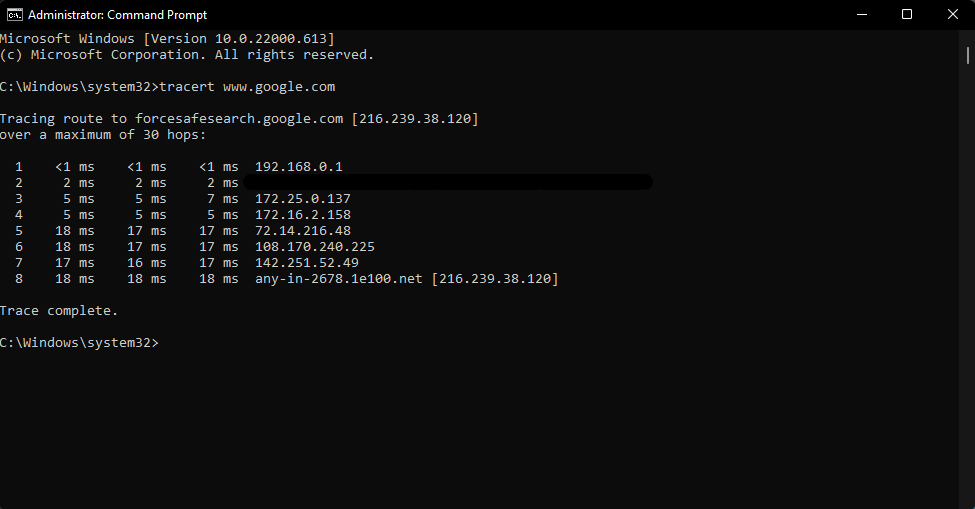
On Windows, you can run a network trace using the tracert command in the Command Prompt. Unlike the UNIX-based traceroute, which uses UDP packets by default, the Windows tracert utility operates using ICMP packets.
Here are the steps to run it:
tracert google.com
The trace results will begin to display, showing the path your connection takes to the destination.
You can also use several options to modify the command’s behavior. Here are the most common flags for tracert:
| Flag | Description |
| -d | Prevents tracert from resolving IP addresses to hostnames. Using this option results in a much faster trace. |
| -h <number> | Specifies the maximum number of hops to search for the target. The default is 30. |
| -w <number> | Sets the timeout in milliseconds to wait for each reply before the connection is considered lost. |
| -4 | Forces the command to use only IPv4. |
| -6 | Forces the command to use only IPv6. |
After learning how to run a trace on different operating systems, the next step is to understand what the results actually mean.
After running the command, your terminal will display the results line by line. While the visual output can vary slightly between operating systems, the core information – the path your data travels – remains the same.
A traceroute report lists every hop a data packet takes to reach its destination. Each line represents one of those hops.
To make sense of the report, you first need to understand what each part of the output means.
Each row in the report is typically divided into three main sections, providing specific details about that step in the journey. Let’s break down a single line from a sample output:

| Component | Example | Description |
| Hop number | 2 | The first number simply counts the hop in the sequence. Here, 2 indicates that it is the second router in the path. |
| Hostname/IP address | 153.92.2.11 (153.92.2.11) | This display the domain name (if available) and IP address of the router at that hop. |
| Round-trip time | 0.952 ms 0.488 ms 0.195 ms | These three times show how long each of the three packets took to get to the hop and return, measured in milliseconds (ms). |
How to identify errors in a traceroute report
Sometimes, a traceroute doesn’t complete smoothly. When issues occur, the report will display specific indicators instead of the usual RTT times.
Here are the most common errors and what they mean:
Next, let’s see how to analyze the patterns in the results to diagnose different types of network problems.
1  192.168.1.1 (192.168.1.1)  1.2 ms  1.5 ms  1.4 ms
2  10.0.0.1 (10.0.0.1)  15.1 ms  14.8 ms  15.2 ms
3  203.0.113.1 (203.0.113.1)  16.0 ms  15.9 ms  16.1 ms
4  198.51.100.1 (198.51.100.1)  155.4 ms  155.2 ms  155.8 ms
5  domain.tld (192.0.2.1)  156.1 ms  155.9 ms  156.0 ms
1  192.168.1.1 (192.168.1.1)  180.1 ms  182.3 ms  181.5 ms
2  10.0.0.1 (10.0.0.1)  185.2 ms  184.9 ms  185.4 ms
3  domain.tld (192.0.2.1)  190.5 ms  191.1 ms  190.8 ms
1  192.168.1.1 (192.168.1.1)  1.2 ms  1.5 ms  1.4 ms
2  10.0.0.1 (10.0.0.1)  15.1 ms  14.8 ms  15.2 ms
3  * * *
4  198.51.100.1 (198.51.100.1)  16.4 ms  16.2 ms  16.8 ms
5  domain.tld (192.0.2.1)  17.1 ms  16.9 ms  17.0 ms
1  192.168.1.1 (192.168.1.1)  1.2 ms  1.5 ms  1.4 ms
2  10.0.0.1 (10.0.0.1)  15.1 ms  14.8 ms  15.2 ms
3  203.0.113.1 (203.0.113.1)  16.0 ms  15.9 ms  16.1 ms
4  * * *
5  * * *

The traceroute command is your go-to tool for diagnosing the path and performance of your network connection. When you run a trace, you should expect to see a hop-by-hop list of routers with corresponding latency times.
Look for patterns in these results: a sudden jump in latency points to a bottleneck, while timeouts can indicate a firewall or a router that doesn’t respond to requests.
By understanding these patterns, you can quickly determine if a network problem is on your end, with an ISP, or at the destination server.
If you’re managing servers or troubleshooting home networks, traceroute should be your first stop.
All of the tutorial content on this website is subject to Hostinger's rigorous editorial standards and values.

Pras has a background in IT education and experience as a website administrator, he hopes to share his knowledge with other tech enthusiasts. In his free time, Pras likes to play video games.

Ariffud is a Technical Content Writer with an educational background in Informatics. He has extensive expertise in Linux and VPS, authoring over 200 articles on server management and web development. Follow him on LinkedIn.

A premium domain name is a high-value domain name that costs more than a regular domain because it’s short, memorable, ...

Domain forwarding means pointing a domain you own to another URL, and it can be done even if you don’t ...

Your domain name is your website’s first impression and choosing the right domain registrar ensures it stays secure, affordable, and ...