Monitoring your website’s resource usage helps you understand how your sites are performing, how you need to optimize your website, and whether you need to upgrade your plan. On the Agency plan, you can track resource consumption across the whole plan as well as per website and analyze WordPress performance in detail.
Resource Usage Overview
Go to Websites → Dashboard → Resources Usage. The data will be shown per hosting plan by default; to display per website, click on the Website button next to Resources overview.
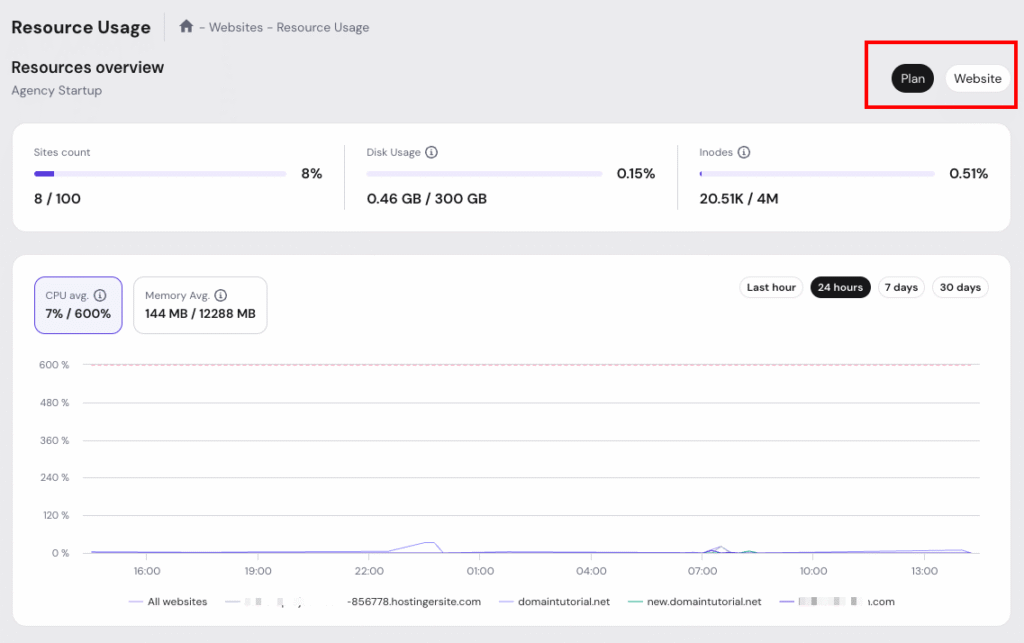
The overview displays three key metrics:
- Sites count – Shows how many websites you are using out of your total allocation
- Disk Usage – Displays your current disk space consumption against your plan limit
- Inodes – Indicates the number of files and folders used
Below the overview, you’ll find detailed graphs for CPU and memory usage:
- CPU avg. – Shows average CPU usage as a percentage of your allocated resources
- Memory Avg. – Displays average RAM consumption
You can view these metrics across different time periods.
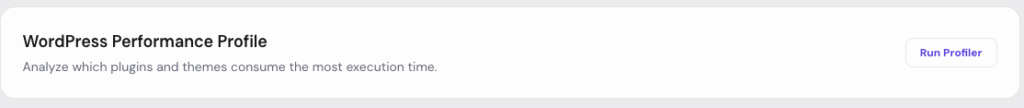
WordPress Performance Profile
For WordPress websites, you can analyze which plugins and themes are affecting your site’s performance. You can find under the Resource Usage Overview → click Run Profiler
The profiler displays the total execution time at the top and breaks down performance by component:
- Component – The name of the plugin, theme, or WordPress core function
- Total – Total execution time for that component
- Max – Maximum execution time recorded
- Hooks – Number of WordPress hooks the component uses
- Usage – Percentage of total execution time, displayed both numerically and as a visual bar
This helps you quickly identify which plugins or themes might be slowing down your website.