What are server performance metrics? How server performance metrics work
Apr 10, 2026
/
Ksenija
/
17 min Read

Server performance metrics are measurements that show how a server uses resources such as CPU, memory, disk, and network, how quickly it responds to requests, and how reliably it remains available.
A server sits behind most digital services, handling requests from websites, apps, APIs, and databases. When that system runs efficiently, pages load faster, actions complete smoothly, and services stay online.
When it does not, delays, failed requests, and outages start to appear. That is why metrics like response time, uptime, error rate, and load are just as important as raw resource usage.
Regular monitoring turns those numbers into early warning signs. It helps you spot bottlenecks before users notice them, understand whether pressure is coming from compute, storage, or traffic, and make better decisions about optimization, scaling, and troubleshooting.
What are server performance metrics?
Server performance metrics are measurements that show how a server uses its resources and how well it responds to requests.
A server is a machine that handles requests and returns responses, but in practice, different parts of the system handle different steps.
- A web server receives the request and sends back a response (like an HTML page).
- An application layer processes logic (for example, logging a user in).
- A database stores and retrieves data.
For example, when you open a website, the web server accepts your request, the application processes your request, the database provides the data, and the final result is sent back to your browser.
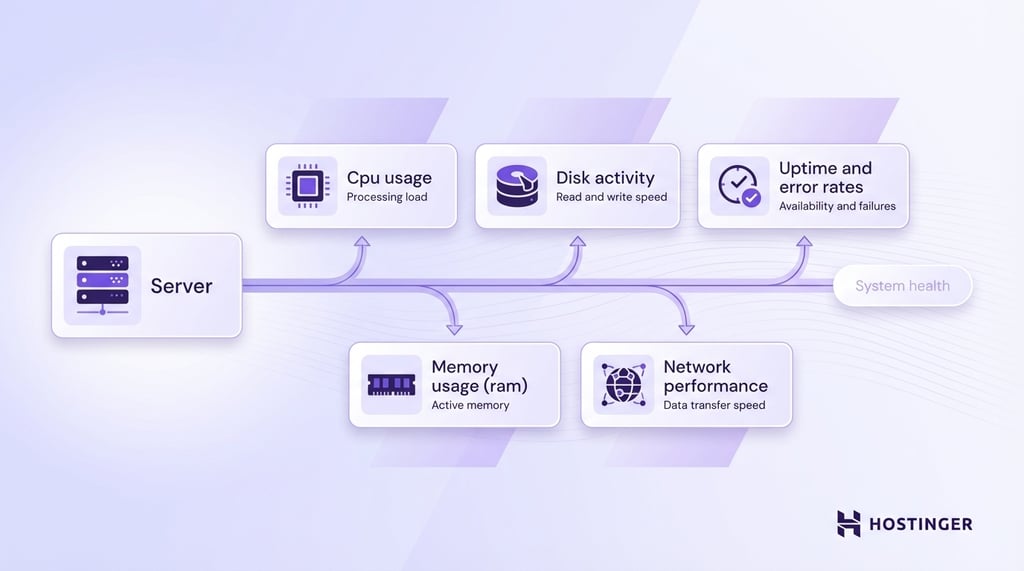
These metrics track the key parts of that process:
- CPU usage – how much processing power is being used to handle tasks.
- Memory usage (RAM) – how much working data the server is holding at a time.
- Disk activity – how fast the server reads and writes data to storage.
- Network performance – how quickly data moves in and out of the server.
- Uptime and error rates – how often the server stays available and how often requests fail.
These are the foundation, but they are not the full picture.
To understand real performance, you also track metrics that show pressure, delays, and capacity limits.
These include response time, request rate, load average, disk latency, queue length, concurrency (how many requests run at once), and swap usage (when memory spills to disk). These metrics explain why a server slows down, not just that it slows down.
The purpose of all these measurements is to detect issues before users feel them. For example, CPU usage might look normal, but a growing queue length tells you requests are piling up. Disk speed might seem fine, but high disk latency reveals slow database queries.
Regular monitoring turns raw data into early warnings. It helps you spot bottlenecks, prevent crashes, and understand how your server behaves as traffic grows.
Key server performance metrics to track
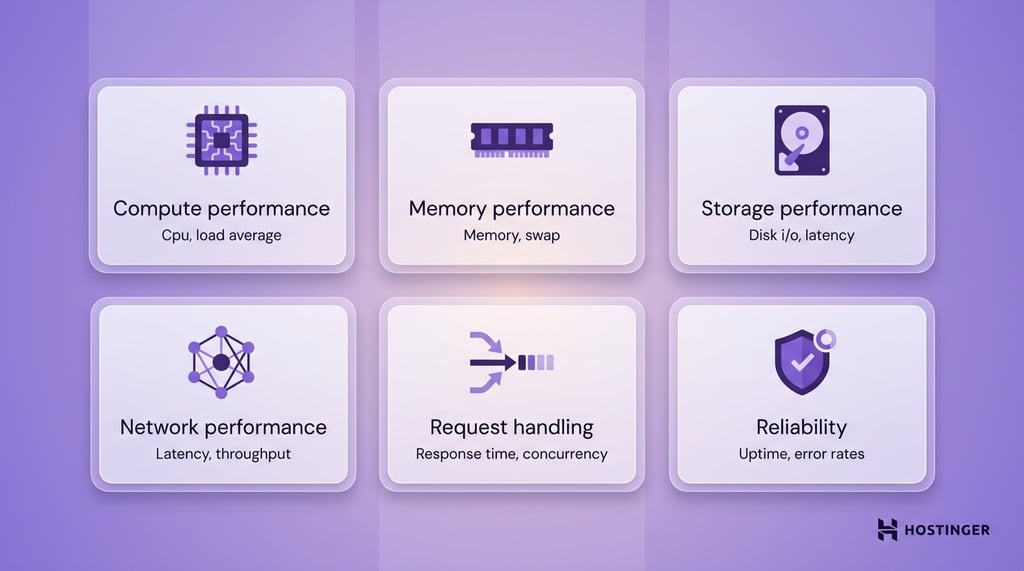
Server performance metrics fall into six core groups that show how your server behaves under load and where it starts to break down.
Each group focuses on a different part of the system, so you can quickly spot what is slowing things down:
- Compute performance – how processing power is used (CPU, load average).
- Memory performance – how efficiently RAM is used (memory, swap).
- Storage performance – how fast and responsive your disk is (disk I/O, latency).
- Network performance – how quickly data moves between systems (latency, throughput).
- Request handling – how the server deals with traffic (response time, request rate, concurrency, queue length).
- Reliability – how stable and error-free the server is (uptime, error rates).
Instead of looking at isolated numbers, you can connect issues to a specific part of the server.
1. CPU utilization
CPU utilization shows how much of your server’s processing power is being used at any moment.
The CPU is what runs code. Every request, whether loading a page, running a script, or querying a database, requires CPU time. If the CPU is busy, everything else slows down.
High CPU usage means the server is close to its limit. When that happens, requests take longer to process, and users start to notice delays.
Here is a simple way to think about it: If your server were a kitchen, the CPU would be the chef. If too many orders come in at once, the chef cannot keep up, and every dish takes longer.
As a general benchmark:
- 0–50% usage means the server has plenty of capacity.
- 50–70% usage shows healthy load with room to grow.
- 70–85% usage signals pressure building under sustained traffic.
- 85–100% usage means the CPU is saturated, and performance will degrade.
Short spikes into high usage are normal. The real problem is consistently high CPU, especially above 80%.
Common causes of high CPU usage include:
- Too many requests hitting the server at the same time
- Inefficient code or heavy background tasks
- Poorly optimized database queries
- Traffic spikes without enough resources
One important detail is that high CPU usage is not always the root problem. Sometimes the CPU stays busy because other parts of the system are slow. For example, if disk operations take too long, tasks build up, keeping the CPU occupied.
That is why you should always look at CPU usage alongside metrics such as load average and response time.
In practice, CPU utilization answers one key question:
Is your server keeping up with the work, or falling behind?
2. Memory consumption
Memory consumption shows how much RAM your server is using at a given time.
RAM is where the server stores data that needs quick access. This includes active applications, user sessions, and cached data.
When memory usage gets too high, the server runs into problems. It may slow down, fail to handle new requests, or crash completely.
Think of RAM as your desk space. If your desk is clean, you can work quickly. If it is covered with papers, everything takes longer because you have no room to work.
As a general benchmark:
- 0–60% usage indicates a healthy memory with plenty of headroom.
- 60–75% usage shows normal operation under moderate load.
- 75–90% usage signals pressure building and limited capacity.
- 90–100% usage means the server is at risk of slowdowns or crashes.
Unlike the CPU, memory should not stay near its limit. A healthy system maintains a buffer to handle sudden spikes in traffic.
High memory usage usually comes from:
- Too many applications or processes running at once.
- Memory leaks, where applications keep using memory without releasing it.
- Large datasets being loaded into memory.
- High traffic that increases active sessions.
When RAM fills up, the server may start using swap, which means it moves data to disk. Disk storage is much slower than memory, so performance drops sharply.
Even small amounts of swap under load are a warning sign. It means the server has already run out of fast memory and is relying on slower storage.
Unlike CPU spikes, high memory usage is more dangerous because it builds up over time. Once memory is exhausted, the server cannot recover easily without restarting processes or freeing resources.
Memory metrics answer one key question:
Does your server have enough working space to handle the current demand without slowing down?
3. Disk I/O (read/write speed)
Disk I/O measures how quickly your server can read data from storage and write it back.
Your server uses disk when it needs data that is not already in memory. This can include loading images, reading database records, or saving user uploads.
If the disk is slow, the entire system slows down, even if CPU and memory look fine.
For example, when someone opens a product page, the server may need to fetch images, load content, and query a database. All of that involves disk operations. If those reads take too long, the page loads slowly.
A practical way to judge disk I/O is by impact:
- Fast disk → pages load quickly and queries return instantly.
- Slow disk → delays appear across the entire application, especially in database-heavy tasks.
Common causes of poor disk performance include:
- Using HDD instead of SSD
- Too many read and write operations at the same time
- Heavy database activity
- No caching, which forces repeated disk access
One important detail is that disk speed alone does not tell the full story. A disk may have high throughput but still feel slow due to delays in completing each operation. That is why disk latency is tracked separately.
Disk I/O answers a simple question:
Can your server move data fast enough to keep up with demand?
4. Network latency and throughput
Network latency and throughput reveal how well your server communicates with users, browsers, APIs, and other systems.
Latency is the delay between sending a request and getting a response.
Throughput is the amount of data transferred per unit of time.
For instance, if a user clicks a button and waits before anything starts loading, that is a latency issue. If a large file starts downloading but moves slowly, that is a throughput issue.
Latency affects speed first. Even small requests feel slow when there is too much delay between systems. Throughput affects capacity. It shows how much data your server can move when traffic increases.
As a general benchmark:
- Low latency means requests move quickly and responses start fast.
- High latency means users feel a delay, even on small actions.
- High throughput means the server can transfer a lot of data without slowing down.
- Low throughput means the connection becomes a bottleneck during larger transfers or heavy traffic.
For many web applications, latency under 100 ms is strong, 100 to 200 ms is usually acceptable, and anything consistently above 200 ms starts to feel slow.
Throughput is harder to benchmark with one fixed number because it depends on the application. A simple website needs far less bandwidth than a video platform or backup service.
Common causes of poor network performance include:
- Long physical distance between the server and the user
- Congested networks or limited bandwidth
- Too many services talking to each other across the network
- Poor routing or misconfigured infrastructure
High latency slows communication between systems. That affects page loads, API calls, database connections, and anything else that depends on fast back-and-forth communication.
This is why network issues are often easy to miss at first. CPU and memory may look healthy, but users still experience a slow application because the delay happens while data travels across the network.
Network latency and throughput answer one key question:
Can your server move data quickly enough and in large enough volumes to keep the application responsive?
5. Uptime
Uptime signals the percentage of time your server stays available and able to respond to requests.
CPU, memory, and speed may all look fine when the system is running, but uptime tells you whether the service is actually available over time.
For example, if someone tries to open your website and gets an error because the server is offline, that is an uptime problem.
Uptime is usually shown as a percentage. The closer that number is to 100%, the more reliable the server is.
Here are simple benchmarks:
- 99% uptime means about 7 hours and 18 minutes of downtime per month.
- 99.9% uptime means about 43 minutes of downtime per month.
- 99.95% uptime means about 22 minutes of downtime per month.
- 99.99% uptime means about 4 minutes and 23 seconds of downtime per month.
At a glance, 99.9% looks almost perfect. In practice, it still means your service is unavailable for nearly three-quarters of an hour every month.
The acceptable level depends on what you run. A personal site can tolerate more downtime than an online store, SaaS platform, or customer portal.
If users rely on your service to log in, make payments, or access data, uptime becomes a business metric rather than just a technical one.
Low uptime usually points to larger problems, such as:
- Server crashes
- Resource exhaustion
- Failed updates
- Network outages
- Misconfigurations
You should also remember that uptime does not show the full user experience. A server can stay technically online while responding very slowly or returning errors. That is why uptime should always be read alongside response time and error rates.
Uptime answers one key question:
How reliably is your server available when people try to use it?
6. Error rates
Error rates indicate how often requests fail rather than succeed.
This metric tells you whether your server is delivering working responses or breaking down during real use. A high error rate means users are hitting problems, even if the server is still online.
A failed request can take different forms. One common example is a 5xx error, which means the problem is on the server side.
If a user tries to open a page and gets a 500 Internal Server Error or 503 Service Unavailable message, that counts toward the error rate.
This matters because availability alone is not enough. A server may stay up, but if it keeps returning errors, the service is still failing.
You can think of it like this: If uptime tells you whether the shop door is open, error rate tells you whether customers can actually place an order once they walk in.
As a general benchmark:
- Below 1% is a healthy target for many applications.
- 1% to 2% is a warning sign that needs attention.
- Above 2% points to a real reliability problem.
Error rates should stay low and stable. If they rise, something is broken or under too much pressure.
Common causes of higher error rates include:
- Overloaded servers
- Application bugs
- Failed database connections
- Timeout issues
- Bad deployments or configuration mistakes
Error rates also help you find problems that other metrics miss. For example, CPU and memory may look normal, but users may still see failures because an app service, API, or database query is breaking in the background.
Error rates answer one key question:
Is your server just running, or is it actually working as expected?
7. Response time
Response time is the time it takes the server to respond to a request.
When response time is low, pages load faster, and actions feel smooth. It also means the server responds faster, helping reduce initial server response time in WordPress and other web applications.
For instance, when someone clicks “Log in” or opens a product page, the server needs time to process the request and send back a result. Response time measures that delay.
Simply put, response time is the gap between asking for something and getting it back.
As a general benchmark:
- Under 200 ms feels very fast.
- 200 to 500 ms is acceptable for many actions.
- 500 ms to 1 second starts to feel slow.
- Above 1 second creates a visible delay and hurts the user experience.
The right target depends on the task. A simple page request should be faster than a complex search or report.
High response time usually comes from:
- High CPU or memory pressure
- Slow database queries
- Disk delays
- Network latency
- Too many requests arriving at once
Improving response time often comes down to server setup and caching. For example, using optimized WordPress hosting with built-in caching like LiteSpeed, which is included in platforms like Hostinger, can help reduce initial server response time in WordPress and other applications.
Response time answers one key question:
How long does a user wait before the server starts delivering what they asked for?
8. Load average (server load)
The load average shows how many tasks are actively using the CPU or waiting for CPU time.
This metric helps you see how busy the server really is. While CPU utilization shows how much processing power is being used, load average shows how many processes are competing for that processing time.
A server can have normal CPU usage and still be under pressure if too many tasks are lined up waiting to run.
Imagine one checkout lane in a store. CPU usage tells you whether the cashier is busy right now. Load average tells you how many people are standing in line. Even if the cashier is not working at full speed every second, a long line still means the system is struggling to keep up.
On Linux systems, load average is usually shown as three numbers. These numbers reflect the average system load over the last 1, 5, and 15 minutes. For example, a load average of 0.50, 0.70, 0.90 means the server had a lighter load in the short term and a slightly higher load over a longer period.
To read the load average correctly, you need to compare it with the number of CPU cores:
- A load equal to the number of CPU cores means the server is fully busy but still keeping up.
- A load below the number of CPU cores indicates spare capacity.
- A load above the number of CPU cores means tasks are waiting, and the server is under strain.
For example:
- On a 4-core server, a load average of 4.0 means the system is fully occupied
- A load average of 2.0 on that same server is comfortable
- A load average of 6.0 means work is backing up
A load of 2 is high on a 1-core server but light on an 8-core server.
High load with normal CPU usage is an important warning sign. It often means processes are stuck waiting on something else, such as disk access, network delays, or blocked application threads.
Common causes of high load average include:
- Too many processes running at the same time
- Slow disk operations
- Heavy database activity
- Traffic spikes
- Applications that block while waiting for other resources
Load average helps you catch bottlenecks early. It shows pressure building before CPU usage reaches its limit and before users feel a major slowdown.
Load average answers one key question:
How much work is the server trying to handle at once, and is that work starting to pile up?
9. Thread count/concurrency
Thread count and concurrency reveal how many requests your server is handling at the same time.
Concurrency is the number of active requests the server is working on at once.
Thread count is one way to support that work, since many servers use threads to process multiple requests in parallel.
Servers do not handle traffic one request at a time. If 500 people open your site at once, the server has to handle many requests simultaneously. That includes loading pages, running app logic, and fetching data.
You can imagine it like this: Concurrency is the number of callers being served at once. Threads are the staff handling those calls. If more callers arrive than the team can handle, wait times grow, and some calls get dropped.
High concurrency is not automatically a problem. It often just means your site or app is busy. The real issue starts when the server cannot keep up with that demand.
As a general benchmark:
- Low to moderate concurrency with stable response times means the server is handling traffic well.
- Rising concurrency with steady performance shows healthy capacity.
- High concurrency with slower response times signals that the server is reaching its limit.
The safe level depends on the server setup. A lightweight static site can handle many more concurrent requests than a database-heavy application.
That is why you should judge concurrency by its effect on response time, error rates, CPU, and memory, not by one fixed number alone.
Too many threads create overhead of their own. Each thread uses memory and CPU time. If the server creates more threads than it can efficiently manage, performance degrades. In that case, the server spends too much time switching between tasks and not enough time finishing them.
Common causes of concurrency problems include:
- Traffic spikes
- Slow database queries
- Long-running requests
- Too many threads configured in the application
- Limited CPU or memory resources
Thread count and concurrency answer one key question:
How many requests can your server handle at once before performance starts to break down?
10. Disk latency (not just I/O speed)
Disk latency is the time the server waits for a disk operation to complete.
This metric is different from disk I/O speed. Disk I/O tells you how much data the server can read or write. Disk latency tells you how quickly each individual operation completes. That makes latency more useful when you want to understand why an application feels slow.
In simple terms, disk I/O speed is how much water can move through a pipe. Disk latency is how long it takes for the water to start flowing after you turn the tap on.
A disk can show decent read and write speeds on paper and still feel slow if each operation takes too long to begin or complete. This is why disk latency often catches problems that raw speed numbers miss.
For example, a database-driven website does not just move large files around. It performs many small, fast reads and writes. If each of those operations is delayed, page loads slow down, searches take longer, and user actions feel sluggish even when total disk throughput looks acceptable.
As a general benchmark:
- Under 1 ms is excellent for modern SSD-based systems.
- 1 to 5 ms is healthy for many server workloads.
- 5 to 10 ms shows growing storage pressure.
- Above 10 ms is a warning sign for performance-sensitive applications.
- Above 20 ms usually causes noticeable slowdowns.
These numbers are general guides, not hard rules. What matters most is consistency. If disk latency rises during traffic spikes or remains high for extended periods, storage becomes a bottleneck.
Common causes of high disk latency include:
- Overloaded disks
- Too many small read and write operations at once
- Slow or aging storage hardware
- Shared hosting environments with heavy neighboring workloads
- Poor database indexing, which increases disk access
Disk latency answers one key question:
How long is your server waiting on storage before it can keep working?
11. Request rate (throughput)
Request rate, often called throughput, shows how many requests your server handles per second.
This metric tells you how much traffic your server is processing in real time. It reflects both demand and your server’s ability to keep up with it.
For example, if your site handles 100 requests per second, that means 100 users are loading pages, calling APIs, or triggering actions every second. As traffic grows, this number should increase without causing slowdowns.
Simply put, the request rate is the number of customers your store serves per second. The higher the number, the busier the store. What matters is whether the service stays fast as more people arrive.
As a general benchmark:
- Increasing the request rate while maintaining stable response times indicates the server is scaling well.
- High request rate with no errors shows strong performance under load.
- A stable or dropping request rate during traffic spikes signals that the server cannot keep up.
Throughput, on its own, is neither good nor bad. A high number usually means high demand. The key is how the server behaves as that number grows.
For example:
- If the request rate increases and the response time stays low, your system is handling the load efficiently.
- If the request rate increases and the response time rises, the server is under pressure.
- If the request rate drops while traffic is expected to be high, requests may time out or fail.
Common causes of throughput issues include:
- CPU or memory limits
- Slow database queries
- Disk or network bottlenecks
- Too many concurrent requests overwhelming the system
Request rate answers one key question:
How much work is your server actually handling, and is it keeping up as demand increases?
12. Queue length
The queue length reveals how many requests are waiting for the server to process them.
This metric tells you whether the server is keeping up with incoming work or letting requests pile up.
A short queue is normal. Servers often have brief moments when a few requests wait their turn. The problem starts when the queue keeps growing. That means new requests are arriving faster than the server can handle them.
When requests sit in a queue too long, pages load slowly, API calls stall, and some actions time out before the server even gets to them.
As a general benchmark:
- A queue that stays near zero means the server is keeping up well.
- Short spikes that clear quickly are usually normal during busy moments.
- A queue that grows and stays high signals the server is falling behind.
- A steadily rising queue is a warning sign that delays and timeouts are coming.
There is no single safe number for every server. The right level depends on how many requests the system can process at once and how quickly it finishes them.
What matters most is the pattern. A queue that keeps building is a problem, even if the number looks small at first.
Common causes of a growing queue include:
- Too many requests arriving at the same time
- Slow application code
- Long database queries
- High CPU or memory pressure
- Too few worker processes or threads
Queue length is especially useful because it shows pressure early. CPU may not be fully maxed out yet, but the line of waiting requests already tells you the system is struggling.
Queue length answers one key question:
Are requests being handled right away, or are they stacking up and forcing users to wait?
13. Swap usage (memory overflow)
Swap usage shows when your server starts using disk space instead of RAM to store active data.
This happens when the server runs out of available memory. Instead of failing immediately, the system moves some data from RAM to disk to free up space. This fallback is called swap.
The problem is that the disk is much slower than RAM. Once the server starts relying on swap, performance drops sharply.
Think of RAM as your workspace, and the disk as storage in another room. If you have to leave your desk every time you need something, your work slows down fast.
As a general benchmark:
- 0% swap usage under load means memory is healthy.
- Any swap usage during normal operation is a warning sign.
- Growing swap usage means the server is running out of memory.
- Heavy swap activity leads to severe slowdowns and instability.
Unlike other metrics, swap is not something you want to “optimize.” The goal is to avoid using it during active workloads.
Common causes of swap usage include:
- Not enough RAM for current traffic
- Memory leaks in applications
- Too many processes running at once
- Sudden spikes in usage without enough headroom
Swap usage is especially important because it signals a deeper problem. The server is no longer operating within its intended limits and is compensating in a way that hurts performance.
Swap usage answers one key question:
Is your server running out of fast memory and falling back to a much slower alternative?
Why monitor server metrics
You should monitor server metrics to see how your server is performing, so small issues don’t turn into user-facing problems.
A server rarely fails without warning. The signals appear first in the metrics. If you track them, you can act early rather than react after users are affected.
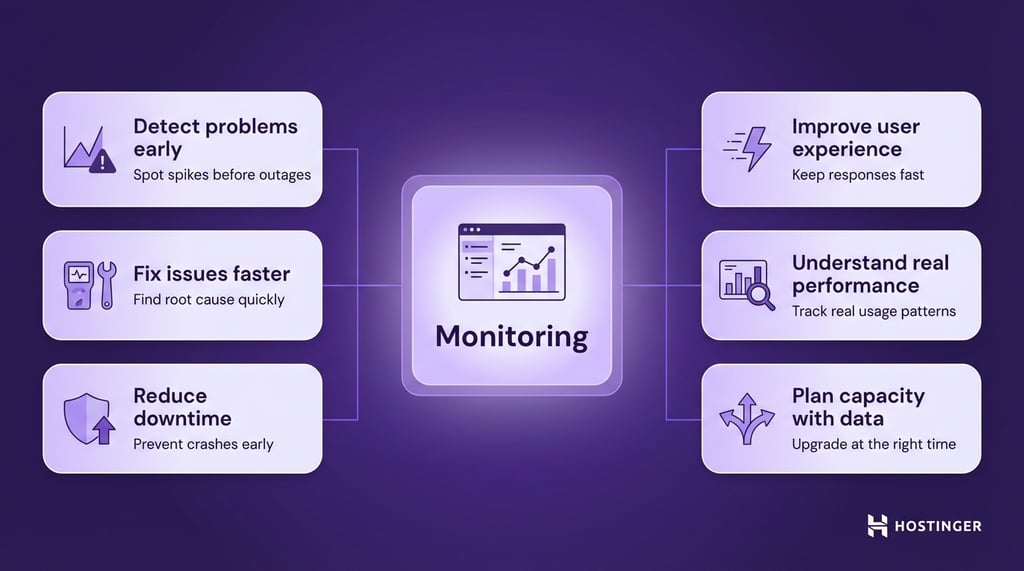
Here is what monitoring helps you do in practice:
- Detect problems early. Spot rising CPU, growing queues, or increasing error rates before they turn into outages.
- Fix issues faster. Identify whether the problem comes from CPU, memory, disk, or network instead of guessing.
- Reduce downtime. Catch warning signs like high load or swap usage before the server crashes.
- Improve user experience. Keep response times low so pages load fast, and actions feel smooth.
- Understand real performance. See how your server behaves during normal use and traffic spikes.
- Plan capacity with data. Know when to upgrade resources or optimize instead of reacting too late.
If your website performance slows down during a traffic spike, metrics can show whether the issue is due to CPU limits, slow database queries, or requests piling up. Without that visibility, you are troubleshooting in the dark.
Monitoring shifts your approach from reactive to proactive. Instead of waiting for complaints, you see issues forming and fix them early.
How to monitor server performance
You monitor server performance by collecting metrics automatically, checking them in one place, and using simple tools to investigate issues when they appear.
The process has three parts: collect data, watch it over time, and act when something changes.
Use a monitoring tool to collect data
You need a tool that tracks your server all the time.
In practice, this means using:
- A hosting dashboard (if your provider includes one)
- A monitoring platform like Grafana, Datadog, or New Relic
- An open-source setup, such as Prometheus with Grafana
These tools collect key metrics such as CPU, memory, disk, and response time, store that data over time, and display it as graphs so you can clearly see trends and changes in performance.
Without this, you only see what is happening right now. With it, you see how performance changes over hours, days, and traffic spikes.
Set up a simple dashboard
Once data is collected, you need to be able to see it clearly.
Start with one dashboard that shows:
- CPU usage and load
- Memory and swap
- Disk performance and latency
- Response time and error rates
- Request rate and queue length
Putting these together helps you connect cause and effect.
For example, if response time increases and queue length grows, your server is falling behind. If CPU is also high, you know where the pressure is coming from.
Add alerts
You should not have to check dashboards all day. Alerts tell you when something needs attention.
Set alerts based on real thresholds:
- CPU above 80–85% for several minutes
- Memory close to full or swap in use
- Response time above normal levels
- Error rate increasing
- Queue length growing
Use command-line tools for quick checks
When something is already slow or broken, you can check the server directly.
These are simple commands you run on the server:
- htop → see CPU, memory, and running processes live
- free -m → check available memory and swap
- df -h → check disk space
- iostat → check disk performance and delays
- ss or netstat → inspect network connections.
Check logs to find the cause
Metrics show that something is wrong. Logs show why.
Look at:
- Application logs for errors
- Web server logs for failed requests
- System logs for crashes or resource issues
Look for patterns, not just current values
One spike does not matter. Patterns do.
Pay attention to:
- Memory slowly increasing over time
- Slower response times during peak hours
- Repeated error spikes after deployments
This helps you fix issues before they turn into outages.
Keep it simple and usable
Start small:
- One monitoring tool
- One clear dashboard
- A few meaningful alerts
You can expand later, but a simple setup you actually use is far more effective than a complex one you ignore.
All of the tutorial content on this website is subject to Hostinger's rigorous editorial standards and values.

Ksenija is a digital marketing enthusiast with extensive expertise in content creation and website optimization. Specializing in WordPress, she enjoys writing about the platform’s nuances, from design to functionality, and sharing her insights with others. When she’s not perfecting her trade, you’ll find her on the local basketball court or at home enjoying a crime story. Follow her on LinkedIn.