Small business statistics 2026: Key data, trends, and insights
Mar 18, 2026
/
Aris S. & Daniela C.
/
7 min Read

If you are starting your own venture, small business statistics reveal what works and what doesn’t. These numbers show you the real success rates, common pitfalls, and financial benchmarks you’ll need to navigate your first years in business.
According to the US Small Business Administration, an enterprise is considered a small business if its number of employees and revenue are below a certain threshold, depending on the industry. For example, small manufacturers have 500 employees or fewer and generate under $7.5 million in annual revenue.
The statistics below cover financing, growth trends, technology adoption, and the biggest challenges facing small business owners in 2026. Use them to set realistic expectations and identify where your business fits in the broader market.
Top 10 small business statistics to know in 2026
The following list highlights the most significant metrics shaping the small business environment this year. These figures offer a snapshot of the economic impact, financial realities, and digital evolution of independent enterprises.
- There are approximately 36.2 million small businesses currently operating in the United States.
- Small firms constitute 99.9% of all US companies, underscoring their dominance in the business landscape.
- Small businesses have been responsible for 88.9% of all net new jobs created in the U.S. recently.
- The initial cost to launch a business typically falls between $50,000 and $175,000 for many entrepreneurs.
- Personal savings remain the primary funding source for new ventures, utilized by 35% of owners.
- Inflation and rising prices are cited as the number one challenge for small business owners in 2026.
- Facebook is the dominant marketing platform, used by 84% of small to midsize businesses.
- The artificial intelligence (AI) market for small and medium businesses is expected to grow rapidly, with a projected CAGR of 28.6% through 2033.
- Despite digital trends, approximately one in three small businesses still operate without a website.
- Business survival remains difficult, with roughly 18% of new firms closing within their first year of operation.
Let’s dive into these in more detail, starting with the more general trends and data.
General small business and growth statistics
General small business growth statistics highlight the state of this ecosystem in the US. If you are looking to start an online business, consider the following data regarding market share and employment impact to help you understand the playing field.
Here are some of the key statistics of small businesses in the country, according to the US Small Business Administration Office of Advocacy:
- Total market presence. As of now, there are around 36.2 million small businesses operating in the US
- Business share. Small businesses make up 99.9% of all U.S. companies.
- Employment impact. Small businesses employ approximately 62.3 million people, representing nearly half of the nation’s total workforce.
- Job creation. Opening and expanding small businesses created a net 1.2 million new jobs, making up 88.9% of all new US job creation during that period.
Another important data, according to Fed Small Business, is about sector dominance. The largest share of small employer firms operates in professional services and real estate, which together account for 20% of all small businesses.
All the above data indicate that small businesses are the major contributors to the US economy. With nearly all companies falling into this category and accounting for almost 90% of new jobs, this sector offers a huge opportunity, but is highly competitive.
Small business finance and funding statistics
Most small business owners start with personal savings, not bank loans. With inflation driving up costs for everything from rent to supplies, understanding your financing options and realistic startup expenses is critical before you launch.
Based on Guidant, important statistics of small business finance and funding include:
- Startup costs. The cost to start a small business varies widely, but 28% of entrepreneurs spent between $50,000 and $175,000.
- Funding sources. Around 20% of small business owners financed their small business with personal savings.
- Financial obstacles. The biggest financial challenges small businesses face include inflation and price increases (22%), followed by a lack of capital or cash flow (18%).
- Economic impact. Increased prices (27%), loss of revenue (16%), and higher wages (10%) were the most reported economic impacts in the small business industry for the past two years.
- Confidence levels. 77% of small business owners expect to survive the current economic climate, while 3% do not, and 19% are unsure.
In addition, Bankrate reveals tht the average loan size for SBA 7(a) loans for small businesses in fiscal year 2026 is $456,595.
Reflecting on the stats, self-funding remains the norm for financing small businesses, indicating a barrier to entry for those without personal capital. While inflation and a lack of capital pose significant challenges, most business owners are confident they can survive in the current economy.
Small business employment and demographic trends
The demographics of business ownership are shifting, seeing a more diverse range of ages, genders, and motivations. Additionally, employment distribution shows that small businesses are major employers in service-oriented sectors.
Key statistics of small business employment and demographics, as shown by Guidant, are:
- Female entrepreneurship. Women own 44.6% of all US businesses and make up 46.9% of workers.
- Motivation. 28% of business owners started their business because they were ready to be their own boss, while 22% were dissatisfied with corporate life, and 13% wanted to pursue their passion.
- Generational ownership. 49% of small business owners are Gen X, 30% are Baby Boomers, and 21% are Millennials.
- Business structure. 35% of small business owners operate a franchise, while 65% own independent businesses.
Meanwhile, the US Small Business Administration Office of Advocacy shows that sectors with the most employees include health care and social assistance (9.26 million), construction (5.94 million), professional, scientific, and technical services (5.62 million), and retail trade (5.45 million).
In terms of small business owners’ income, Payscale estimates the number to reach around $75,000 annually.
Nearly half of small business owners are Gen X, and most started their businesses for one reason: independence. These firms employ millions of workers, especially in healthcare and construction. Women now own close to half of all small businesses in the US.
Social media and marketing statistics for small businesses
Digital marketing continues to evolve, with social media platforms serving as the primary advertising channel for small enterprises. As ad costs increase, businesses are prioritizing paid social strategies and outsourcing marketing tasks to remain competitive.
Our affiliate marketing statistics also suggest that partnerships can give small businesses access to new customer segments.
Some of the important trends related to social media and marketing statistics for small businesses, according to Statista, are:
- Ad spend. The average small or medium-sized business (SMB) in the US. is projected to spend about $78,000 on advertising, contributing to a total $640 billion in advertising expenditures among all SMBs nationwide.
- Platform preference. 84% of small to midsize businesses used Facebook to promote their products and services, making it the most popular social media platform.
- Ad formats. About 34% of USB SMB leaders who sell goods online identified social media ads as one of the three most important advertising formats for promoting products on marketplaces.
- Channel strategy. About 31% of respondents said their organizations used three marketing channels, while 2% reported using as many as eight.
- Outsourcing. 52% of US small and medium-sized businesses outsourced at least some of their marketing in 2026.
- Budget intentions. 51% of SMBs said they planned to increase their advertising budgets.
Aside from the rise of advertising, Data Insight Market approximates that the social media marketing tools market for small businesses is projected to reach approximately $45 billion by 2033, growing at a compound annual rate of around 15%.
The digital marketing channel also becomes the priority for small business owners. According to Guidant’s survey, 18% of respondents plan to invest in digital marketing, compared to 10% who plan to invest in traditional marketing.
Small businesses are increasing their advertising budgets, with a clear preference for digital channels over traditional media. Facebook remains the dominant platform, and the complexity of multi-channel marketing is driving more than half of these companies to outsource their marketing efforts.
Technology and digital adoption among small businesses
Technology adoption, particularly artificial intelligence (AI), is becoming a defining factor for small businesses’ efficiency and growth. While some business owners are already adopting new AI tools, a substantial number of businesses lag in basic digital infrastructure, such as having a website.
Here’s a more in-depth look at small business statistics in terms of technology and digital adoption:
- AI market size. Growth Market Reports estimates that the global AI market for small and medium businesses is projected to grow to USD 86.5 billion by 2033, with a CAGR of about 28.6%.
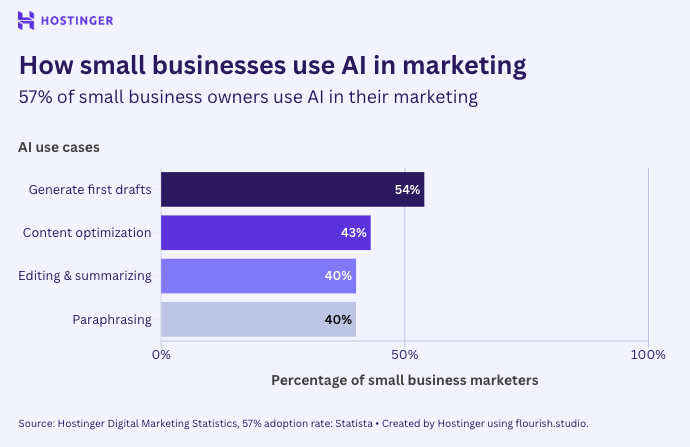
- AI usage. According to Statista, 57% of small business owners and marketers reported using artificial intelligence in their marketing activities.
- AI applications. Based on Hostinger’s digital marketing statistics, marketers increasingly rely on AI to streamline content creation, with 54% using it to generate first drafts, 43% to optimize content, and over 40% employing it for editing, summarizing, and paraphrasing tasks.
- Adoption drivers. Statista shows that 61% of small business owners and marketers using AI in marketing said that it saves time, while 50% cited idea generation as another key reason.
- Tech hurdles. Around 29% of small businesses faced challenges utilizing technology, such as ecommerce, cybersecurity, or social media, according to Small Business Credit Survey.
- Website absence. Hostinger’s ecommerce statistics reveal that about one in three small businesses still don’t have a website.
There is a widening gap between small businesses leveraging AI for efficiency and those that lack a basic online presence. While the AI for the small business sector is booming, the fact that 33% of businesses operate without a website suggests significant untapped potential for digital transformation.
Biggest challenges for small businesses
Survival rates for new businesses are historically low, and current economic conditions have added pressure to small enterprises. From securing loans to managing operational costs and retaining staff, small business owners face a variety of internal and external hurdles.
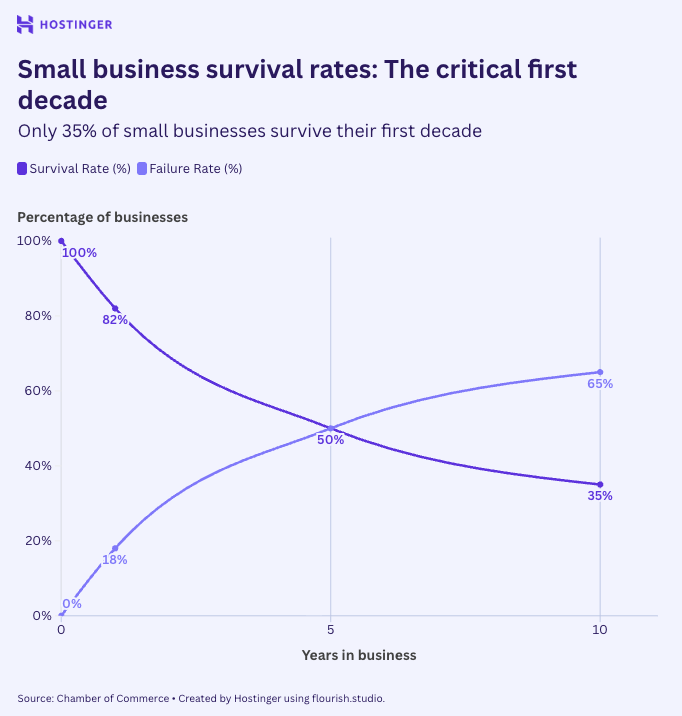
According to the Chamber of Commerce, the failure rate of small businesses remains high, with about 18% closing within their first year, half fail within five years, and nearly 65% shut down within a decade of operation.
Meanwhile, the US Small Business Administration Office of Advocacy reveals that small businesses still depend heavily on credit. While small enterprises account for 88.9% of US job growth, many rely on loans under $1 million.
Here are other statistics about the challenges small businesses face, according to the Small Business Credit Survey:
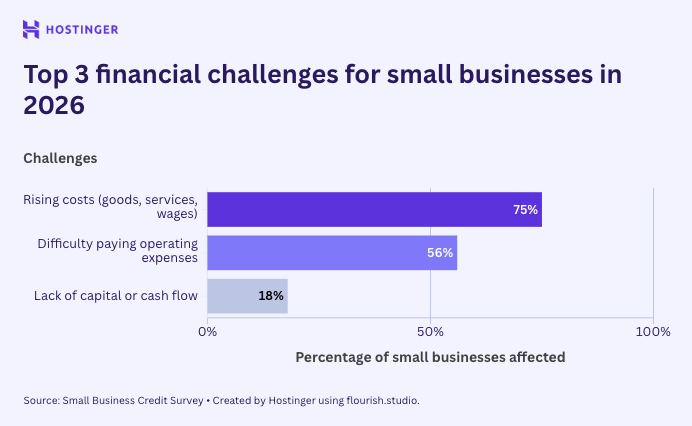
- Operational costs. Around 75% of small businesses cited rising costs of goods, services, and wages as their top financial challenge, and 56% reported difficulty paying operating expenses.
- Growth barriers. Reaching customers and growing sales is the most common operational challenge, affecting 57% of employer firms.
- Staffing issues. About 51% of firms said hiring or retaining qualified staff remained an operational issue, though slightly less severe than in previous years.
Inflation and rising operating costs are the primary threats to small business longevity in 2026. While securing credit and hiring staff remain difficult, the high failure rate within the first five years emphasizes the need for strong financial planning, capital runway, and market adaptation.
The future and digital growth of small businesses
The data for 2026 highlights a resilient but evolving small business sector. While entrepreneurs face significant economic headwinds, such as inflation and the cost of capital, they continue to drive job creation and innovation.
The shift toward digital tools is accelerating, with AI adoption becoming standard for marketing and operations. However, the digital divide remains, as a significant portion of enterprises still lack a business website.
Looking ahead, the integration of AI in business strategies and a stronger focus on digital presence will likely be the deciding factors for companies aiming to survive beyond the critical five-year mark. With this in mind, having a business website or a social media account becomes an integral strategy to remain competitive.
All of the tutorial content on this website is subject to Hostinger's rigorous editorial standards and values.

Aris is a Content Writer specializing in Linux and WordPress development. He has a passion for networking, front-end web development, and server administration. By combining his IT and writing experience, Aris creates content that helps people easily understand complex technical topics to start their online journey. Follow him on LinkedIn.

Daniela is an Off-Site SEO Specialist with extensive expertise in link building, digital PR, and content optimization. She has led international outreach campaigns across the U.S., Brazil, France, and Spain, securing high-quality backlinks. Follow her on LinkedIn.