Google Analytics 4 tutorial: How to set up GA4 and use it effectively
Mar 10, 2026
/
Larassatti D.
/
11 min Read

Google Analytics 4 (GA4) is a Google platform for tracking how users interact with your website or app using an event-based data model.
This means every user interaction, such as page views, clicks, form submissions, and purchases, is captured as a separate event rather than grouped into sessions. This approach makes GA4 more flexible and better suited for cross-platform tracking.
GA4 is suitable for a wide range of users, from website owners to marketers who want better visibility into how their content and campaigns perform. While GA4 can feel complex at first, you can learn progressively. If you’re a beginner, you can start with a basic understanding of how your website works and what actions matter most to your goals.
To set up GA4, you’ll need to complete three main steps:
- Create a property and data stream to generate your Measurement ID.
- Install GA4 on your website, either directly or through Google Tag Manager (GTM).
- Verify the setup using the Realtime report or DebugView.
Once your tracking is in place, you can configure key events to measure important goals, such as form submissions or purchases.
From there, GA4’s reports and explorations help you understand not just what happened on your site, but also why it happened. These insights allow you to make data-driven marketing decisions and continuously improve your performance.
How to set up Google Analytics 4 (GA4)
Setting up GA4 involves three main steps: creating a property and data stream, installing the tracking code on your website, and verifying that data flows correctly.
The entire process usually takes 15-30 minutes, depending on the installation method you choose.
To demonstrate the process, we’re focusing on the Web as the data stream choice.
1. Create a GA4 property and data stream
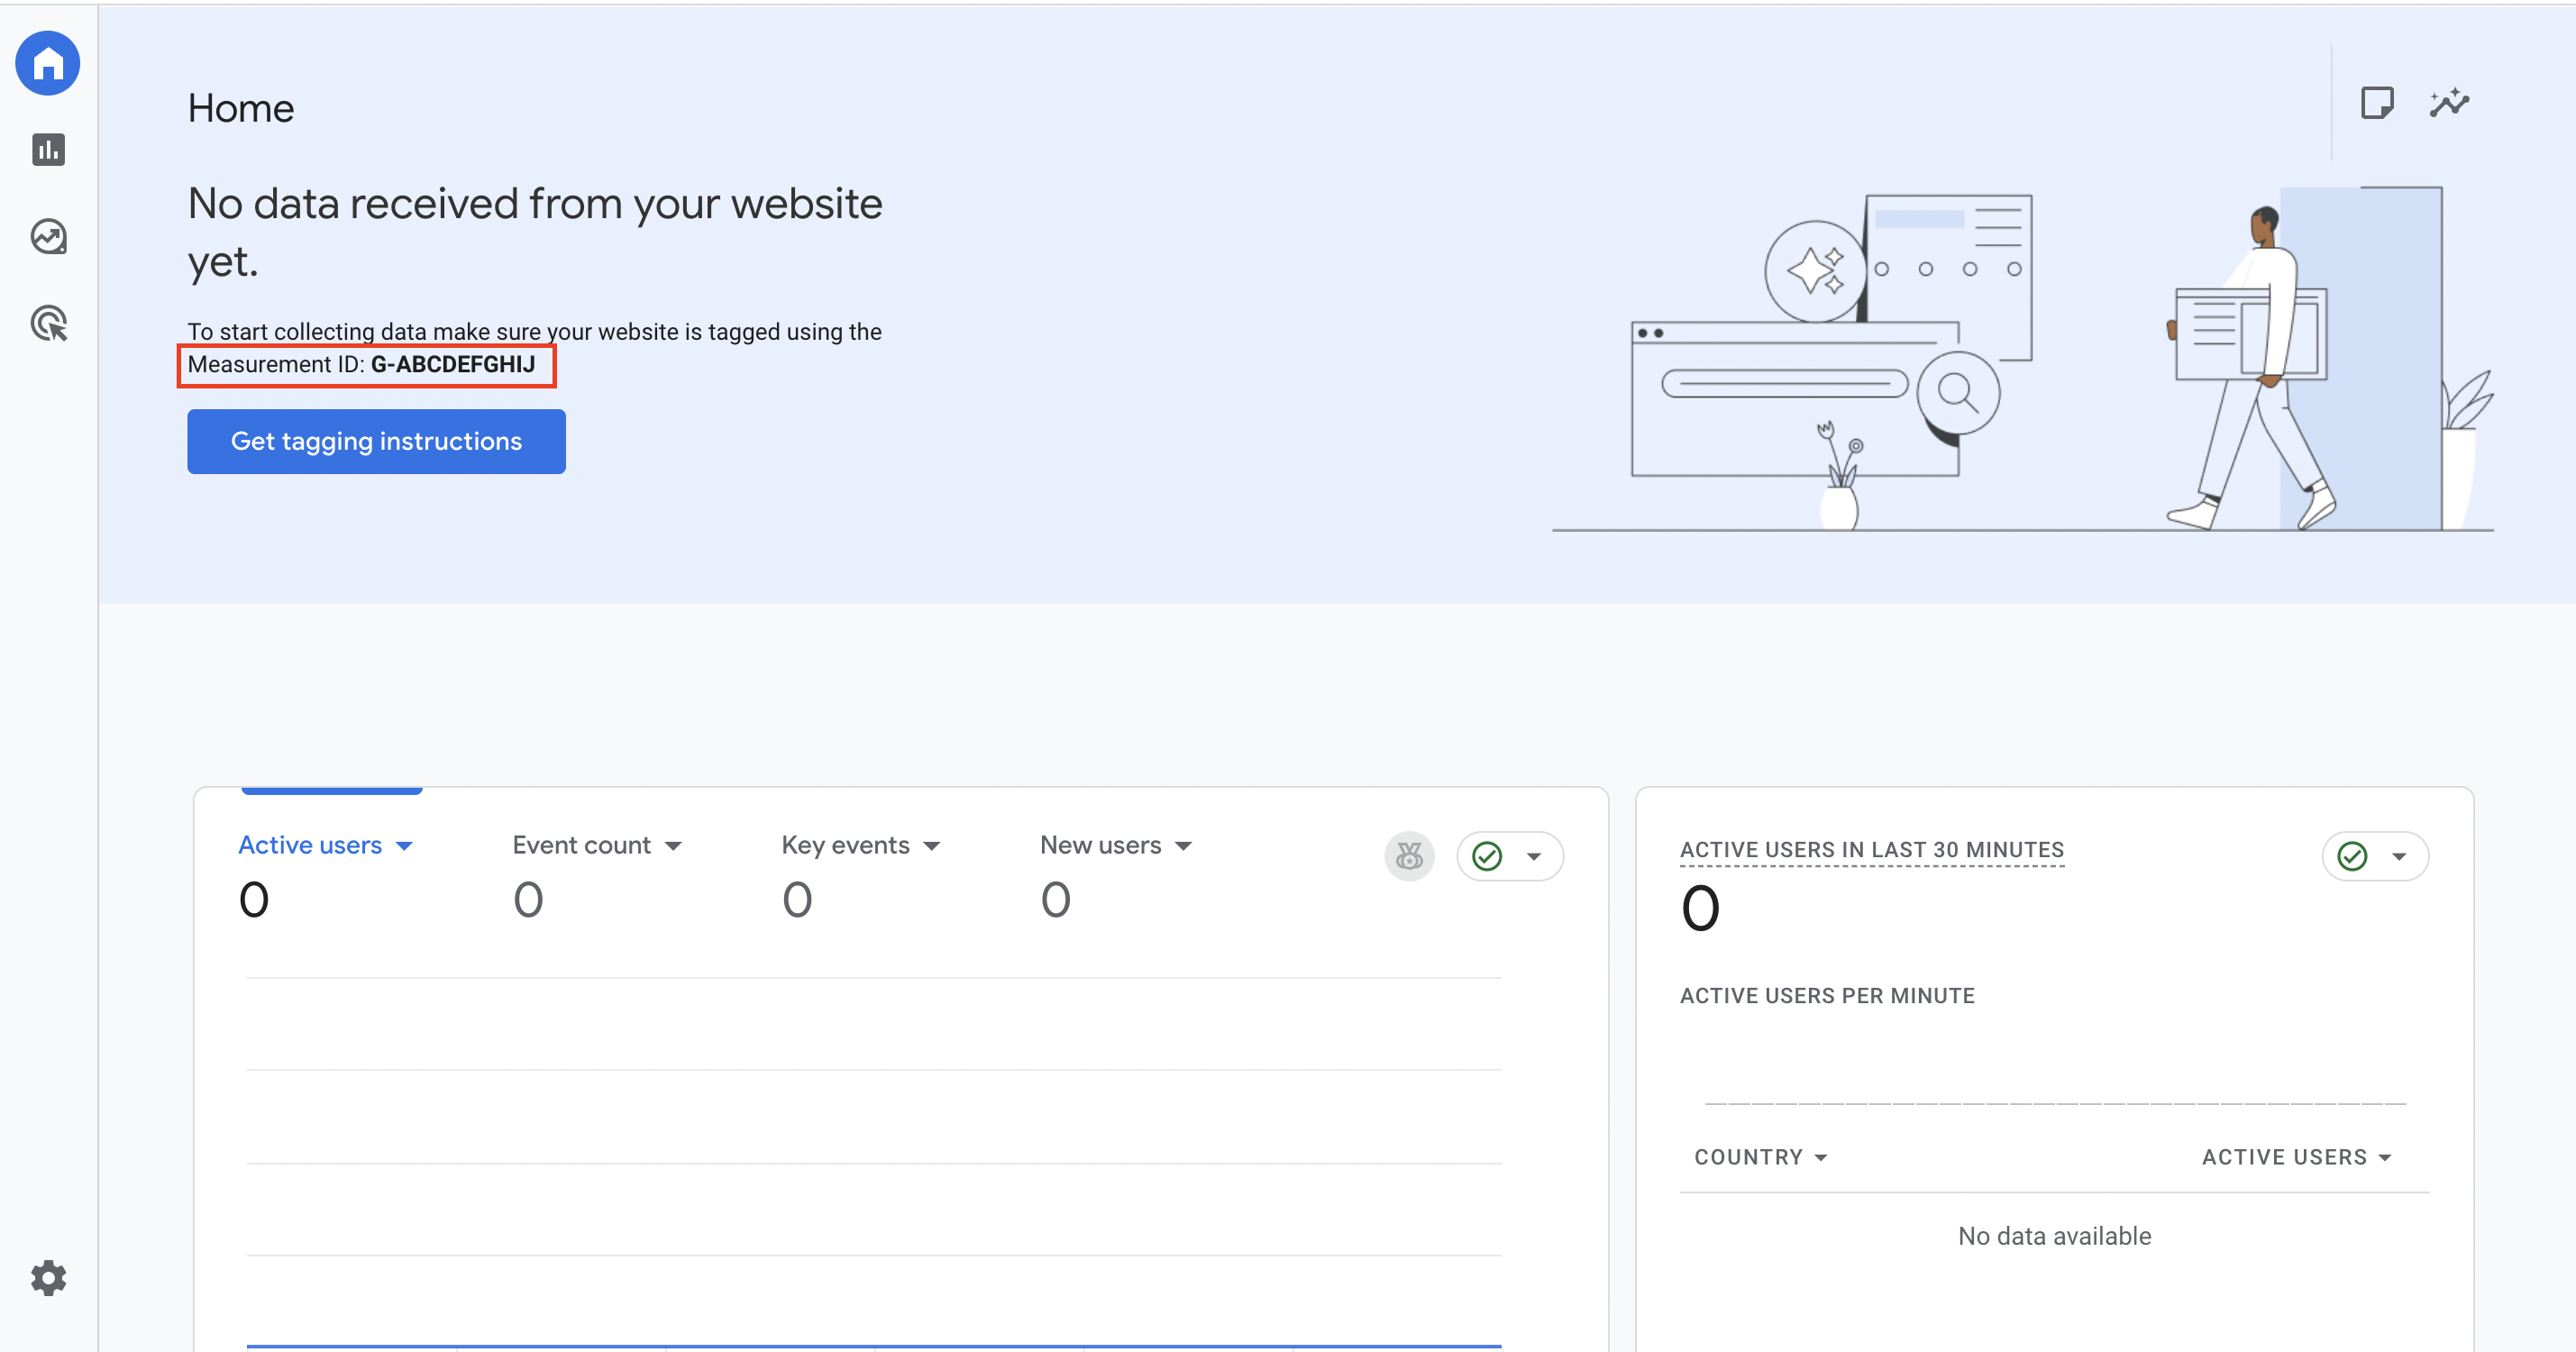
Before you can start tracking activity, you need to create a GA4 property and get your Measurement ID. This ID helps Google identify which platform the collected data belongs to.
Here’s how to set up a new GA4 property and find your Measurement ID:
- Go to Google Analytics and sign in to your Google account.
- Click Start measuring and enter an account name.
- Add a property name, usually your website name, then select your industry, business size, and objectives. Click Create.
- On the Start collecting data page, choose Web as your platform.
- Enter your website URL and a Stream name, then click Create & continue.
After returning to the Home section, you’ll find your Measurement ID, which begins with “G-”. You’ll use this ID to connect GA4 to your website in the next step.
Creating a data stream in GA4 doesn’t immediately start data collection. To begin tracking user activity, install GA4 on your website using your Measurement ID to connect your site to your GA4 property.
There are two main ways to install GA4, depending on how much control you need:
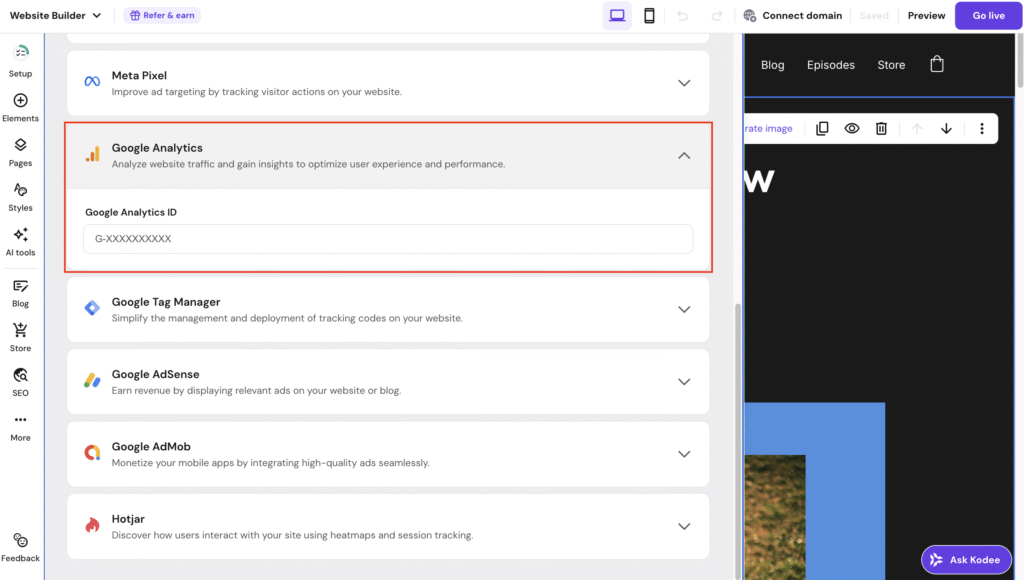
- Direct Integration. You can add GA4 by inserting the Measurement ID into your site’s code, using a Google Analytics WordPress plugin, or enabling it through built-in settings in website builders like Hostinger Website Builder. This is ideal for standard traffic reporting and “set-it-and-forget-it” setups.
- Google Tag Manager (GTM). For a more flexible setup, install GA4 through GTM. It allows you to manage multiple tracking tools in one place and expand your tracking without editing your site’s code again. With GTM, you can:
- Track advanced interactions like button clicks, file downloads, and form submissions.
- Manage tools like Google Ads or Meta Pixel alongside GA4.
- Keep your site code cleaner by avoiding multiple tracking scripts.

2. Install GA4 with Google Tag Manager
To install GA4 via Google Tag Manager (GTM), you’ll first create a GTM container, add it to your website, and then configure a GA4 tag.
Create a GTM container
- Go to Google Tag Manager and sign in.
- Click Create Account, then enter your business name and country.
- In Container setup, add your domain name and select Web.
- Click Create and accept the terms.
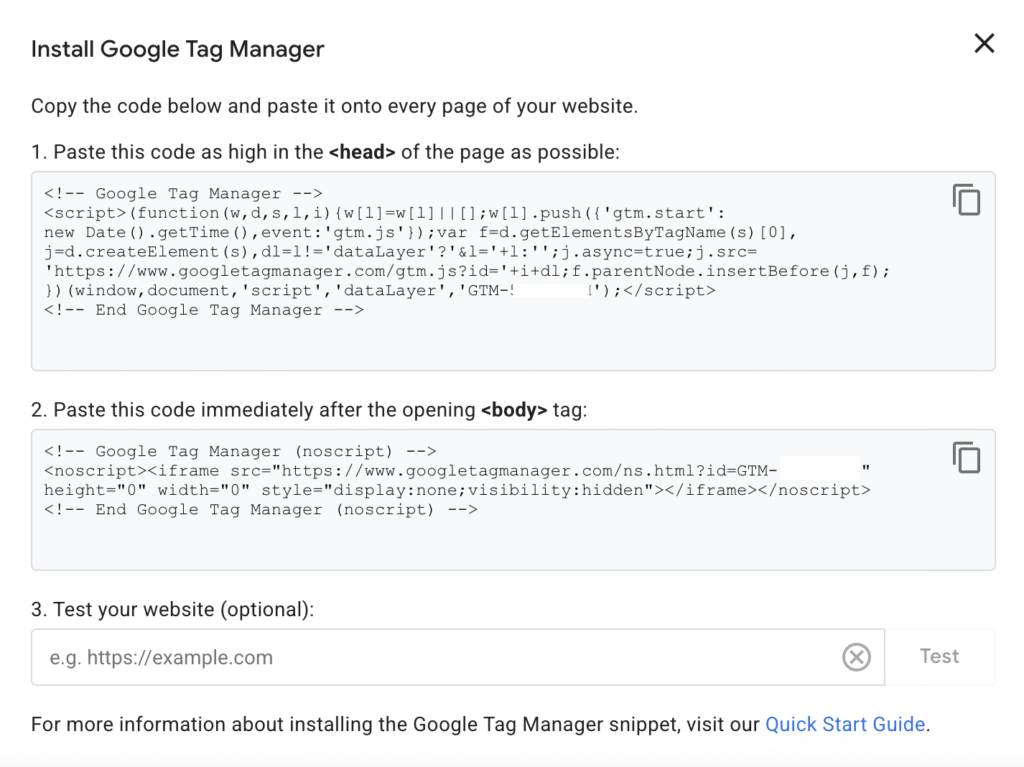
GTM will generate two code snippets — keep this window open, as you’ll need them next.
Add GTM to your website
How you install GTM depends on your setup:
- WordPress. Use a plugin and paste the GTM ID from the code snippet, which begins with “GTM-XXXXXX”, or add snippets manually to the functions.php file. For more details, follow our step-by-step guide on how you can add Google Analytics to WordPress.
- Website builders. Most platforms support GTM natively — just paste your GTM ID. As an example, you can see how to connect Google Tag Manager to a site built with Hostinger Website Builder.
- Custom-coded websites. Manually paste the snippets into your site’s HTML:
- Place the first snippet inside the <head> on every page.
- Paste the second snippet immediately after the opening <body> tag.
Once installed, GTM can load and manage all your tracking tags.
Add GA4 to GTM
Now connect GA4 to your site through GTM:
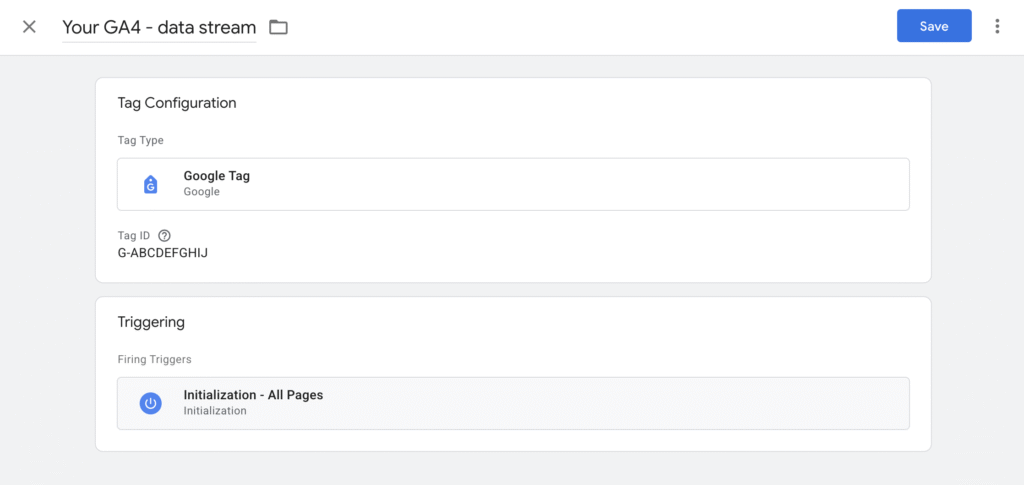
- In GTM, click Tags → New.
- Click the pencil icon in the Tag Configuration section, and select Google Tag.
- In the Tag ID field, paste your GA4 Measurement ID.
- In the Triggering section, select Initialization – All Pages. This ensures GA4 starts up before any other tags.
- Name the tag and click Save.
- Once you see the new tag in the Tags menu, check it and click Submit.
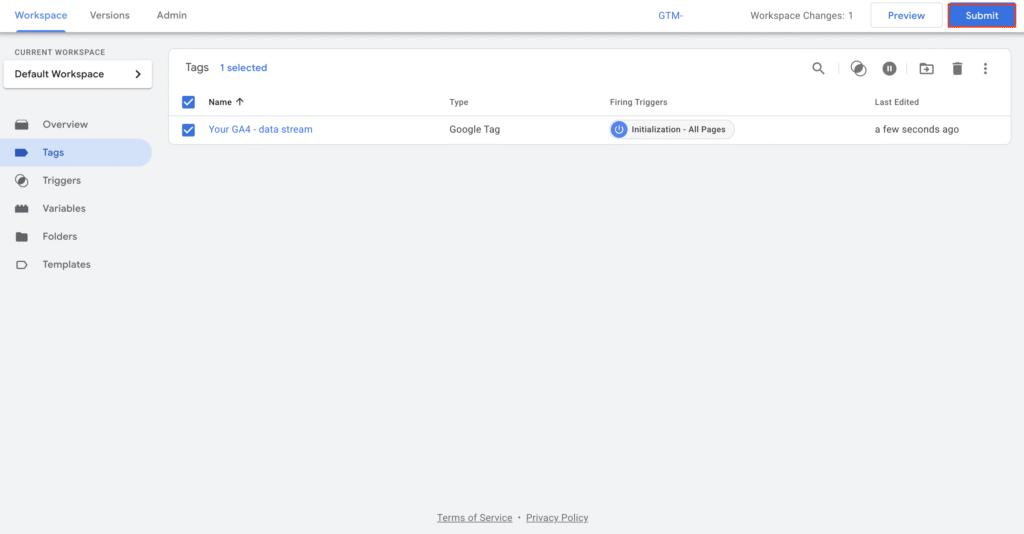
- Finish by hitting the Publish button.
3. Verify GA4 data collection (Realtime and DebugView)
Since GA4 runs silently in the background, you won’t see visible changes on your website. To confirm that your data tracking is active and working correctly, you can use the Realtime reports or the DebugView methods.
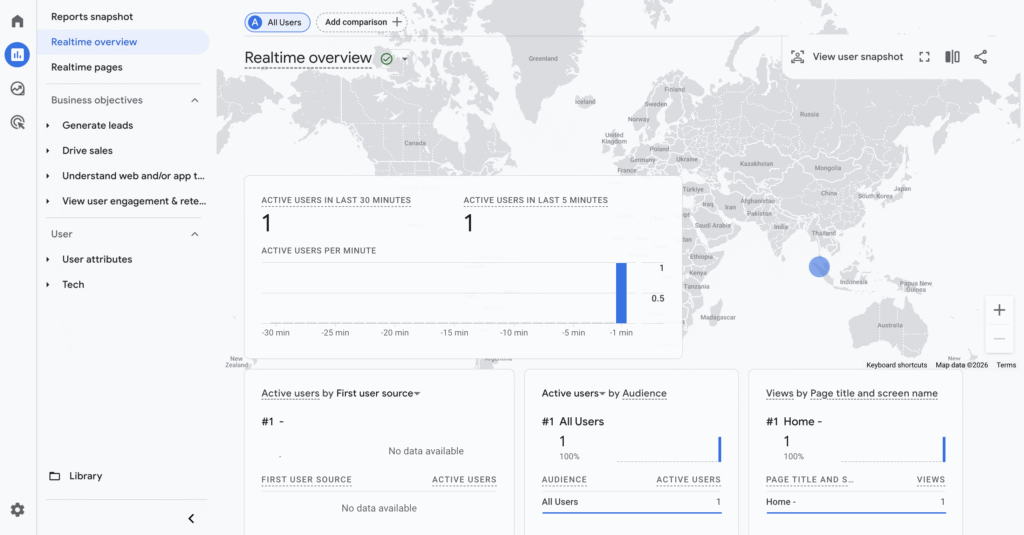
Realtime reports
Realtime reports show user activity from the last 30 minutes, so this is the simplest way to check that the tracking works properly.
Do the following to check GA4 data collection in real time:
- In GA4, go to Reports → Realtime overview.
- Open your website in a new tab or on your phone.
- Within about 30 seconds, you should appear as an active user.
If you don’t see activity, check if any of these elements are blocking the data tracking:
- Ad blockers. Having an ad blocker installed in a browser often prevents the GA4 script from running entirely. You can solve this by testing in an Incognito window with extensions disabled.
- Cookie consent banners. If you declined your site’s cookie consent banner, GA4 is legally blocked from tracking your activity.
- Internal IP filters. If your company has filtered out the office IP address, you won’t show up in Realtime. Use your phone’s cellular data to bypass this.
- Unpublished GTM. If you use GTM, double-check that you have already clicked Submit → Publish.
DebugView
While Realtime shows that someone is accessing your site, DebugView shows exactly what data is being sent. It provides a second-by-second timeline, making it ideal for validating custom events.
These are the steps to check GA4 data collection using DebugView:
- Go to Admin → Data Display → DebugView on your Google Analytics dashboard.
- Enable debug mode on your site. The easiest ways to do this are to keep your GTM Preview tab open or to use the Google Analytics Debugger extension in Chrome (make sure debug mode is enabled).
- Browse your site and watch the events appear in the vertical timeline.
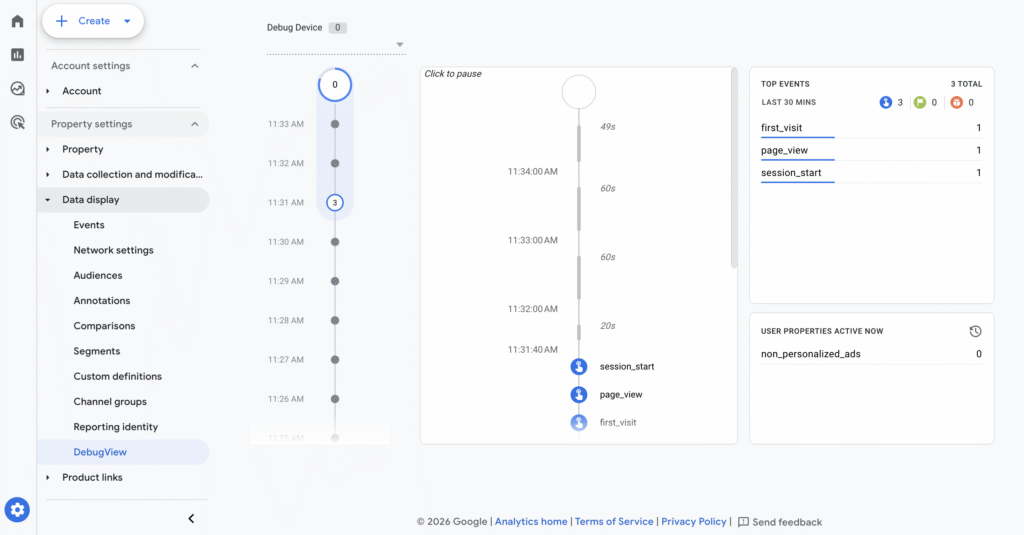
You’ll know that your GA4 data tracking works correctly if:
- Realtime shows at least one active user as you’re viewing the page on your device.
- DebugView shows page_view events every time you change pages.
- Events in DebugView don’t display orange warning icons that indicate invalid data formats.
How GA4 events and key events work
GA4 uses an event-based model, meaning every user interaction is tracked as an individual event with additional context (parameters). Instead of grouping actions into sessions, GA4 focuses on what users actually do: clicks, scrolls, purchases, and more.
Events
Events track every user interaction on your website or app. GA4 organizes events into four categories:
- Automatically collected events. GA4 tracks these events by default as soon as you install it:
- first_visit. The user’s first session.
- session_start. The start of a new session.
- user_engagement. Triggered when a page stays in focus for at least 10 seconds.
- page_view. Page loads.
- Enhanced Measurement events. GA4 collects these events automatically when you enable Enhanced Measurement in your data stream settings:
- scroll. The user scrolls to 90% of the page.
- click (outbound clicks). The user clicks a link that leads to another domain.
- view_search_results. The user performs a site search. This requires a query parameter like ?s= or ?q=.
- video_start, video_progress, video_complete. Tracks YouTube video engagement.
- file_download. The user downloads a file with common extensions like .pdf, .docx, or .xlsx.
- Recommended events. They follow Google’s naming conventions and unlock additional reporting features. Common examples include:
- login. The user signs in.
- sign_up. The user creates an account.
- purchase. The user completes a transaction.
- add_to_cart. The user adds an item to their cart.
- generate_lead. The user submits a lead form.
- Custom events. They are events you create that don’t match Google’s recommended names. Use them to track unique interactions specific to your business, such as contact_form_submit or pricing_page_click.
💡 Use recommended event names instead of custom ones whenever possible. They integrate automatically with Google Ads for bidding optimization and unlock built-in ecommerce and key event reports.
Key events
Key events (formerly conversions) are the specific user actions you identify as vital to your business success. You can mark GA4 default events as key events or set up custom ones. They can be anything from a lead form submission to a purchase to a whitepaper download.
You can access all your GA4 events by navigating to Admin → Data display → Events. If you want to mark any Recent events as a key event, you can simply click the star icon on the left side of the event.
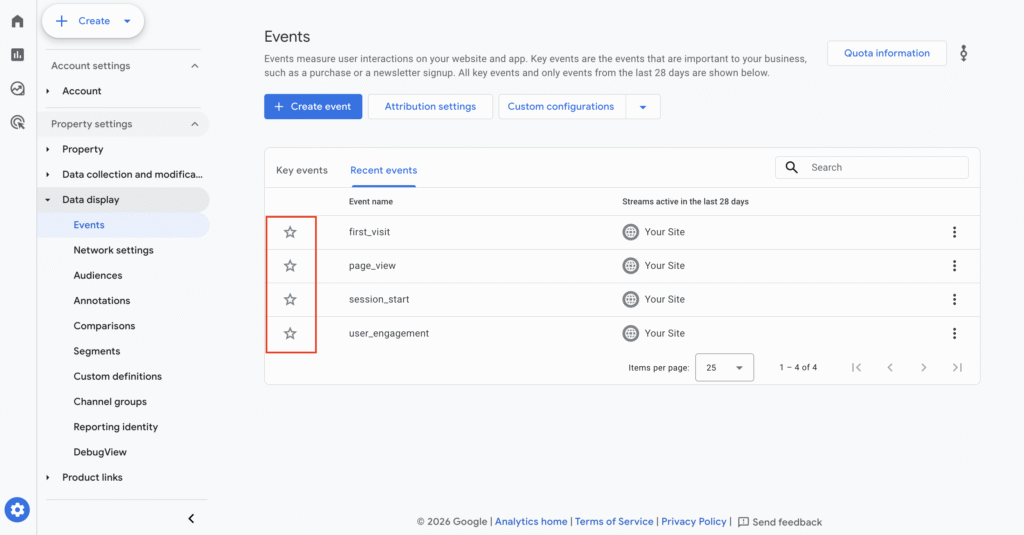
Note that the purchase event is marked as a key event by default on GA4, and you can’t unmark it.
If you want to create a new key event, click on the Create event button and make sure you’re enabling the Mark as key event toggle.
When naming the event, follow Google’s naming convention: use all lowercase letters and an underscore separator, for example, generate_lead.
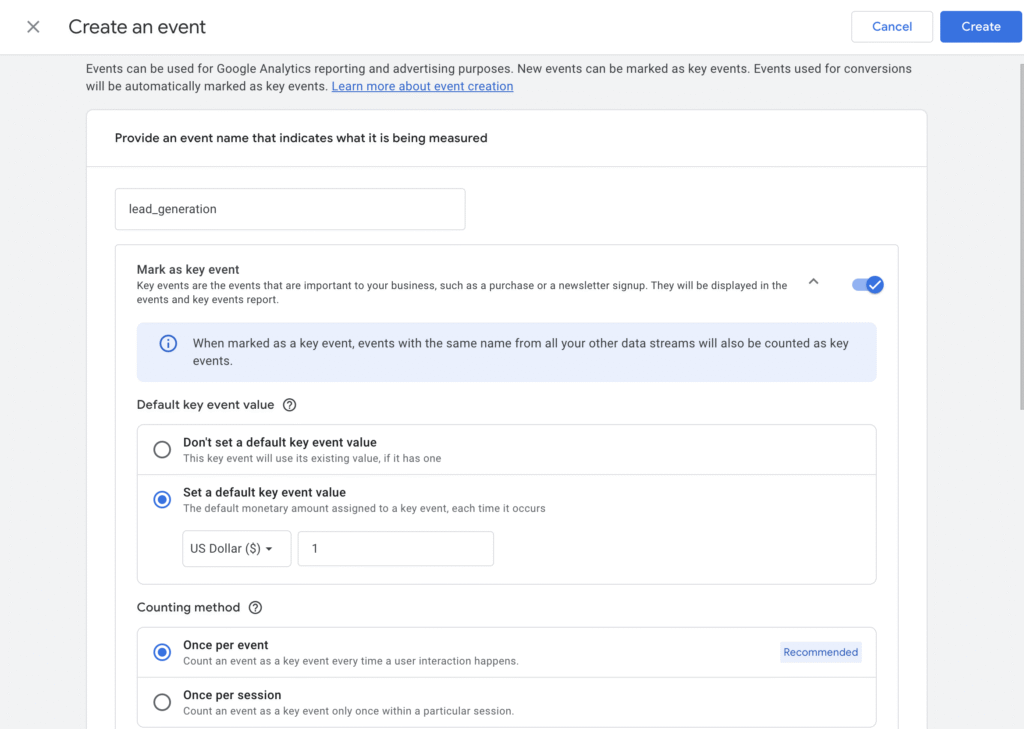
You can control how GA4 counts each key event:
- Once per event (default). Counts every instance. If a user submits a form three times, GA4 records three key events.
- Once per session. Counts one instance per session, even if the event happens multiple times.
To change this, go to Admin → Data display → Key events, click the event, then select Change counting method.
Alternatively, creating new events in GTM will automatically sync to Google Analytics, which you can simply mark as a key event.
We suggest marking events that directly indicate business value, such as:
- Form submissions (generate_lead).
- Purchases (purchase).
- Account registrations (sign_up).
- Quote requests.
- Phone calls that require a call-tracking integration.
Avoid marking micro-interactions like page views or scrolls as key events. These inflate conversion numbers and make your data harder to act on.
➡️ If you can’t see your newly created event, that’s normal, as you may need to wait for up to 24 hours for an event to appear in the list.
How to use Google Analytics 4 reports and explorations
GA4 organizes your data into two main areas: Reports and Explorations.
Reports are prebuilt dashboards that answer common questions about your traffic and performance. Explorations are custom analysis tools that help you investigate specific behaviors in more detail.
Put simply, Reports answers “What is happening on my site?” and Explorations helps you dig deeper and explain “Why is it happening?”
Let’s break them down.
Reports: Your main source of insights
The Reports section contains the standard dashboards you’ll use often. These reports help you monitor traffic, engagement, conversions, and user behavior over time.
What you see here depends on your setup:
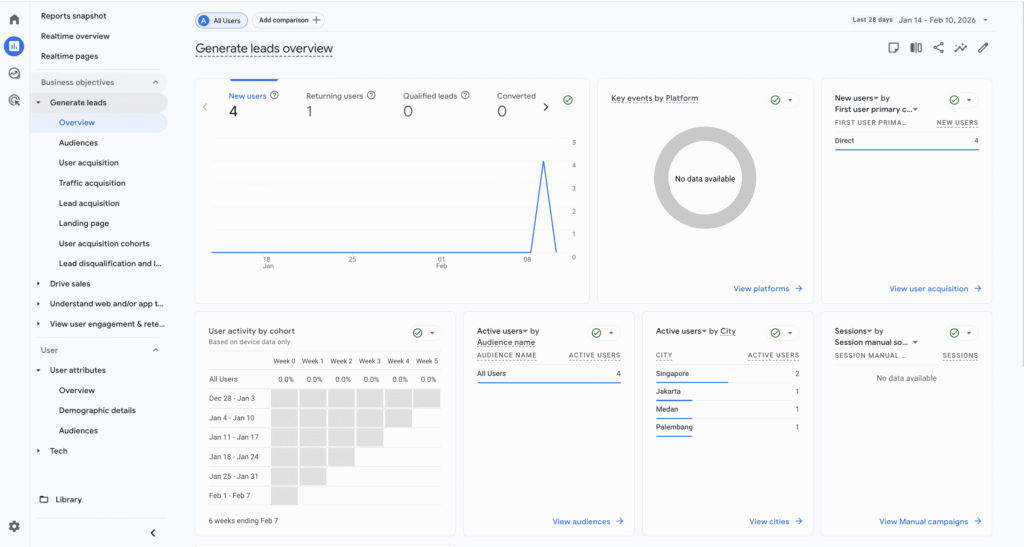
- If you selected business objectives during setup, GA4 creates a tailored Business objectives collection.
- Otherwise, you’ll see the default Life cycle collection.
While the labels may differ, both collections contain essentially the same data, just organized to match your focus. Across these menus, you’ll find reports covering the following areas:
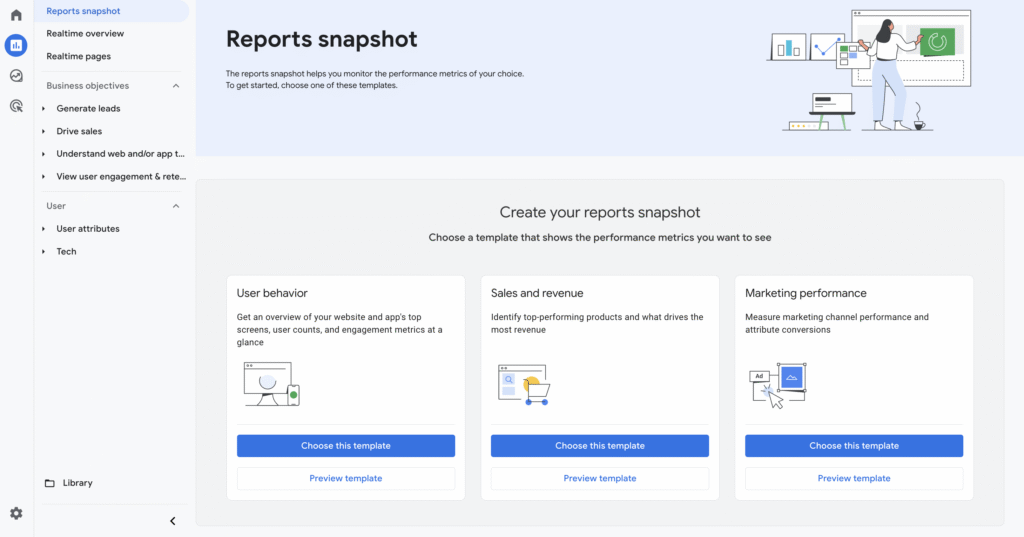
- Reports snapshot. A high-level overview of users, revenue, and key events. Think of this as your main dashboard.
- Realtime. What users are doing on your site in the last 30 minutes.
- Acquisition. Where users come from, including organic search, social media, paid ads, and referrals.
- Engagement. Focuses on how users interact with your site. Review page performance, events, and engagement time to identify strong or weak content.
- Monetization. Tracks revenue-related metrics, such as purchases and product performance.
- Retention. Shows how often users return over time, helping you measure loyalty and long-term growth.
These reports give you a complete view of the user journey, from discovery to conversion and repeat visits.
You can customize most reports using the pencil icon in the top-right corner of a report. This opens GA4’s report builder, where you can adjust dimensions, metrics, and chart types, or apply filters to better match your needs.
For broader changes, such as rearranging sidebar menus, renaming sections, or hiding reports you don’t use, you can open the Library at the bottom of the sidebar. This is where you manage the overall structure of your Reports navigation and keep your GA4 workspace focused and clutter-free.
Keep in mind that these options are only available if you have Editor or Administrator permissions.
Explorations: Deeper, custom analysis
While standard reports provide high-level summaries, Explorations give you access to raw event-level data. This workspace allows you to stress-test your data by dragging and dropping specific dimensions and metrics into advanced, customizable layouts.
Explorations are best used once you’re comfortable with GA4’s standard reports and need answers to more specific questions, such as why users convert or don’t.
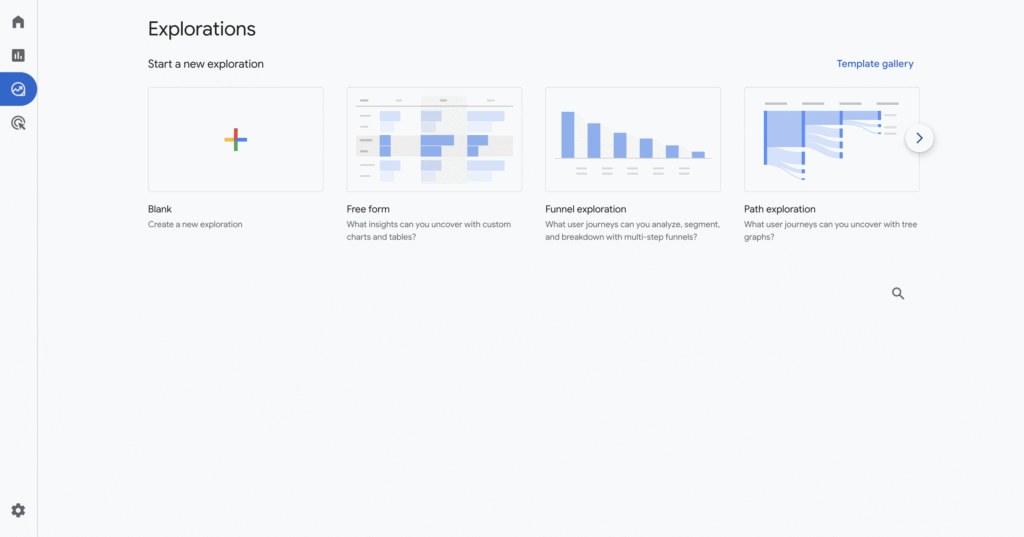
You can use Explorations to:
- Build custom funnels
- Compare audience segments
- Analyze user paths
- Create tailored reports for specific business goals
To move beyond basic reporting, Explorations include multiple modes:
| Mode | Best used for | Practical question example |
| Free-form | Custom tables and charts | Which city drives the most high-value transactions? |
| Funnel exploration | Visualizing conversion steps | Where do users drop off during our 5-step checkout? |
| Path exploration | Analyzing navigation patterns | What pages do users visit after reading a specific blog post? |
| Segment overlap | Comparing audience groups | How many mobile users are also newsletter subscribers? |
| User explorer | Reviewing individual user journeys | What actions did a user take before making a $500 purchase? |
| Cohort exploration | Measuring retention over time | Do users acquired in January return more often than those from February? |
By default, GA4 retains event-level data required for Explorations for 2 months.
To analyze historical data, go to Admin → Data settings → Data retention, and set the retention period to 14 months. If you leave it at the default, your explorations will appear empty for any date range older than 60 days.
How to analyze and act on GA4 data
GA4 can feel complex, but its strength is context. It shows not just how many users visit your site, but where they come from, what they do, and which actions actually drive results.
To turn data into decisions, focus on three areas: traffic sources, content performance, and conversion paths.
Evaluate traffic sources
Start by identifying which channels bring in the most valuable users, not just the most visitors.
Go to Reports → Acquisition → Traffic acquisition and set the primary dimension to Session source/medium.
Compare channels based on Engagement rate and Key event rate, instead of just sessions.
Expert tip
Pay close attention to situations where user behavior doesn’t match what you would expect from a channel.
If paid traffic brings in users but shows low engagement or conversion rates, it’s a strong signal that budget is being wasted. This usually means the landing page doesn’t deliver on the promise made in the ad, or there’s another issue in the user experience.
The same applies to social media traffic. If users arrive and leave immediately without engaging, it may indicate a mismatch between the content, the audience, or the landing page.

Analyze content performance
Next, review how individual pages perform.
Go to Reports → Engagement → Pages and screens and sort by Average engagement time. Look for pages where users spend a long time, but that receive relatively few views.
These pages are often strong content pieces that simply need more visibility. You can feature them on your homepage, link to them from other posts, or include them in email campaigns.
Also, check pages with high exits, especially product or signup pages. A high exit rate may signal a technical issue or a missing call to action.
Expert tip
Look for patterns in your data. When multiple pieces of content underperform in similar ways, those similarities can point to a shared issue that needs to be fixed. On the other hand, identifying patterns behind high-performing content helps you understand what works, so you can replicate the formula and double down on your effort.
Understand conversion paths
At the bottom of the funnel, look at how different channels work together before a conversion.
Go to Advertising → Attribution → Conversion paths to see the sequence of touchpoints that lead to key events.
You’ll often notice that some channels introduce users to your brand, while others close the sale. For example, social media or display ads may appear early in the path, while direct or organic traffic appears at the end.
This insight helps you avoid undervaluing channels that assist conversions, even if they are not the final click.
Expert tip
Identifying your “money channels,” which are the ones that consistently convert, is key to success. Once you know what works, you can scale those channels faster and allocate your resources more effectively.
How to use GA4 to improve an ecommerce marketing strategy?
Google Analytics 4 helps you move beyond surface-level metrics and build a more effective ecommerce marketing strategy, based on real user behavior.
Instead of relying on assumptions, you can see how users discover your store, how they interact with your content, and what drives them to convert. This makes it easier to invest in the right channels, improve weak points in your funnel, and focus on what actually generates revenue.
Use GA4 on a regular basis to:
- Focus on high-value traffic sources. Identify which channels drive customer acquisition and allocate your budget more strategically.
- Improve product pages and checkout flows. Use engagement metrics and funnel data to spot where users drop off and optimize those steps.
- Optimize campaigns using real behavior data. Refine targeting, promote high-interest products, and retarget users who didn’t complete their purchase.
- Build long-term customer value. Analyze retention and lifetime value reports to identify loyal customers and shape your long-term marketing strategy.
In short, GA4 transforms your store data into actionable marketing insights. When you understand where your customers come from, how they interact with your site, and what influences their purchasing decisions, you can build more effective campaigns and improve overall ecommerce performance.

All of the tutorial content on this website is subject to Hostinger's rigorous editorial standards and values.

Larassatti Dharma is a content writer with 4+ years of experience in the web hosting industry. She has populated the internet with over 100 YouTube scripts and articles around web hosting, digital marketing, and email marketing. When she's not writing, Laras enjoys solo traveling around the globe or trying new recipes in her kitchen. Follow her on LinkedIn


Comments
December 13 2022
hi, thanks for this useful tutorial, i have question, i just made the tag for preorder button and every thing is working fine, but it does not appear as an event in my google analytics account. the triggers is firing and in debug view i can see my tag working, but is this data collected?
December 15 2022
Hey there! If your eCommerce tag does not reflect in your Google Analytics data this indicates an issue with the configuration. It is critical that Data Layer be formatted exactly as Google specifies in its documentation. This includes the data structure, attribute names, value format, and so on.