How to use the traceroute command to diagnose network issues
Dec 02, 2025
/
Prasasti P. & Ariffud M.
/
8 min Read
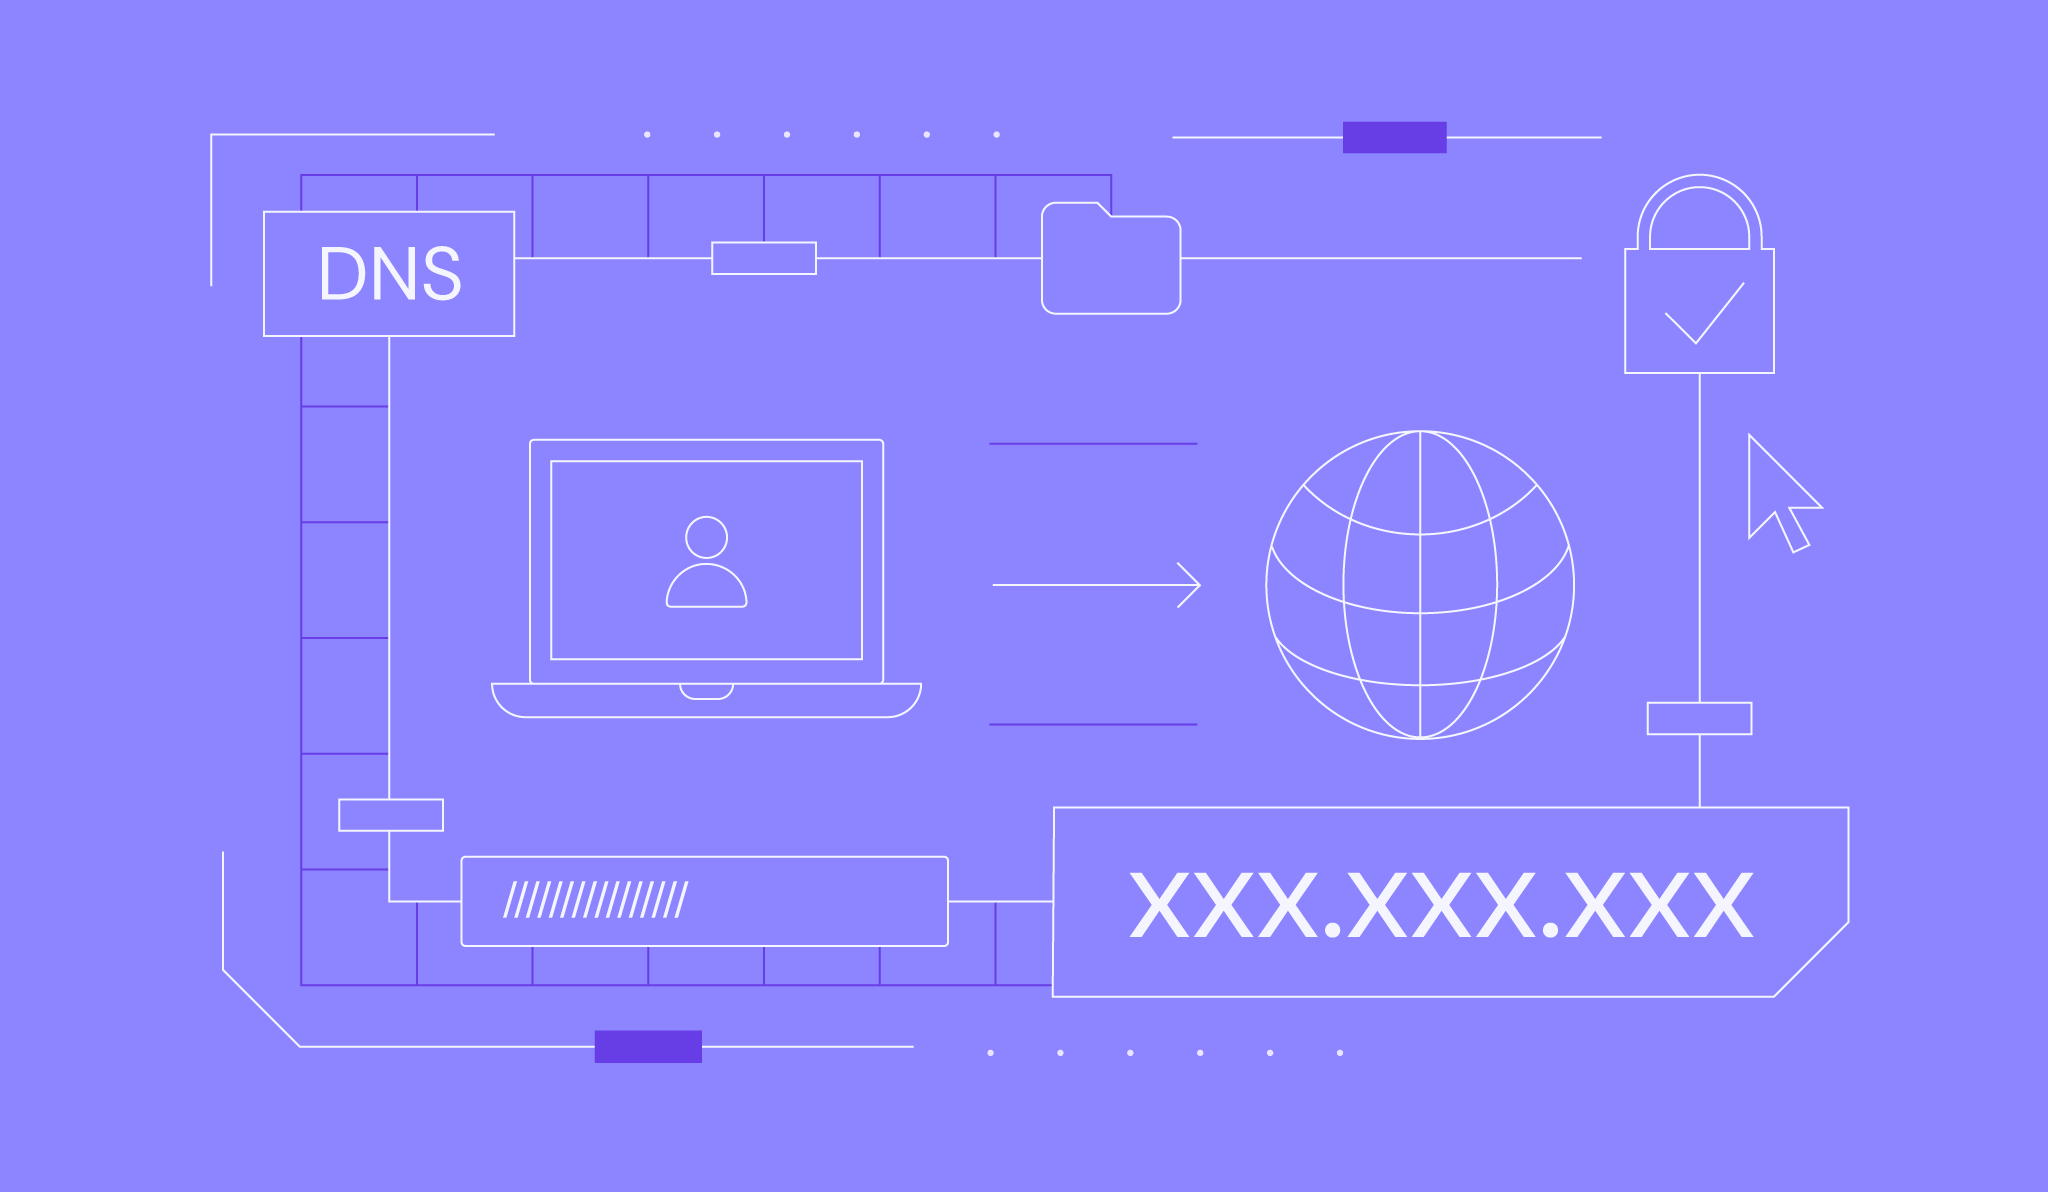
The traceroute command is a network diagnostic tool that shows where connection problems occur. It works by mapping the path your data packets take from your computer to a destination server, displaying each “hop” along the way.
Traceroute is especially useful when your internet connection feels slow or a website won’t load.
Keep reading to learn how to use traceroute on macOS, Linux, and Windows. We’ll also explain how to read the output to identify common network issues like high latency and packet loss, so you can pinpoint the source of connection problems.
What is the traceroute command?
The traceroute command maps the path data packets take from a source computer to a destination server. It reveals every step, or “hop,” of the journey, making it essential for network troubleshooting.
The command works on most operating systems, though its name varies: Linux and macOS use traceroute, while Windows uses tracert.
Here’s a simple breakdown of how it works:
- Traceroute sends a small data packet with a time-to-live (TTL) value of 1. This value is like a countdown timer. The packet travels to the first router, which decrements the TTL to 0, causing it to “expire.” The router then sends a “Time Exceeded” message back to your computer.
- Traceroute sends another packet, this time with a TTL of 2. This packet successfully passes the first router and reaches the second router before its TTL expires. The second router then sends the “Time Exceeded” message back.
- This process continues, with traceroute increasing the TTL value by one for each new packet. By recording the source of each “Time Exceeded” message, it builds a complete map of the route your data takes until it finally reaches its destination.
This step-by-step mapping is what separates traceroute from the simpler ping command.
In short, ping tells you if you can reach a server and measures the total round-trip time, while traceroute shows you how you get there and pinpoints where any delays are happening along the way.
When should you use traceroute?
You should use the traceroute command to diagnose network performance issues and pinpoint the exact location of connection slowdowns or failures.
It helps you determine whether a connectivity problem lies within your local network, with your internet service provider (ISP), or on the destination server’s network.
The main situations where running a traceroute is useful are below:
- Identify network bottlenecks. If a website is loading slowly, traceroute can show which specific router in the path is causing the high latency.
- Detect packet loss. When the traceroute output shows asterisks instead of a time, it indicates that data is being lost at that point in the connection.
- Understand the network path. It visualizes the physical journey your data takes across the internet, helping you see if the routing is efficient.
- Locate network failures. If you can’t connect to a server, traceroute shows you exactly where the connection stops, identifying the source of the failure.
For example, if the results show a long delay immediately after your home router, the issue is likely with your ISP.
Now that you understand what traceroute does and when to use it, let’s look at how to run the command on your operating system.
How to run the traceroute command
Running a traceroute is simple using your system’s built-in command-line application, such as Terminal or Command Prompt.
While the core function is the same, the exact steps and command name differ slightly depending on whether you are using macOS, Linux, or Windows.
Below, we’ll walk through the specific instructions for each operating system.
How to use traceroute on macOS
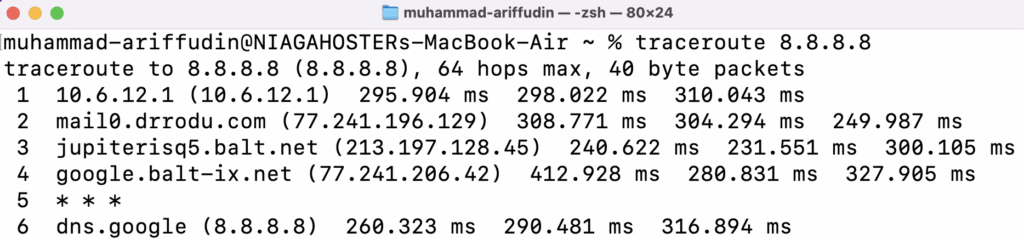
On macOS, the standard way to run a traceroute is by using the built-in Terminal application. Here’s how to do it:
- Find Terminal in Finder → Applications → Utilities, or just use Spotlight (Command + Spacebar) to search for it.
- Type traceroute followed by the destination domain or IP address and hit Enter. For example:
traceroute 8.8.8.8
The output will immediately begin to populate in the Terminal, showing each hop of the connection’s path.
For more specific diagnostics, you can add flags to the command. Here are some of the most commonly used ones:
| Flag | Description |
| -I | Uses ICMP packets instead of the default UDP. This is useful if a firewall is blocking UDP traffic. |
| -n | Shows only IP addresses instead of resolving hostnames. This can significantly speed up the trace. |
| -q <number> | Sets the number of probe packets sent to each hop (default is 3). traceroute -q 1 is faster. |
| -m <number> | Sets the maximum number of hops (max time-to-live) for the trace. The default is usually 64. |
| -w <number> | Sets the time in seconds to wait for a response from a probe (default is 5). |
| -p <port> | Specifies the destination port to use for the trace. |
Since macOS and Linux are both UNIX-based operating systems, the process for running traceroute and the available options are nearly identical. Let’s cover the steps for Linux next.
How to use traceroute on Linux
For Linux users, you can run a traceroute through the Terminal. The traceroute command comes pre-installed on most Linux distributions.
If the command isn’t found, you can easily install it using your system’s package manager.
- On Debian/Ubuntu:
sudo apt update && sudo apt install traceroute
- On CentOS/RHEL:
sudo dnf install traceroute
Here’s the simplest way to run a trace:
- Access the Terminal in your applications menu or by using the keyboard shortcut Ctrl+Alt+T.
- Run the traceroute command. For instance:
traceroute hostinger.com
The Terminal will then display the route, listing each hop it takes to reach the destination server.
By default, the Linux traceroute command sends UDP packets. If you need to send ICMP packets instead – which is how the Windows tracert utility works – you can use the -I flag:
traceroute -I hostinger.com
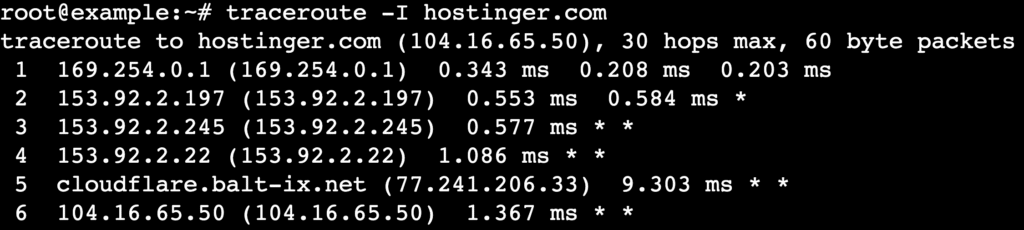
This is a useful option for troubleshooting networks that may handle UDP and ICMP traffic differently.
Now, let’s look at how to perform the same task on Windows, which uses a slightly different command and protocol.
How to use tracert on Windows
On Windows, you can run a network trace using the tracert command in the Command Prompt. Unlike the UNIX-based traceroute, which uses UDP packets by default, the Windows tracert utility operates using ICMP packets.
Here are the steps to run it:
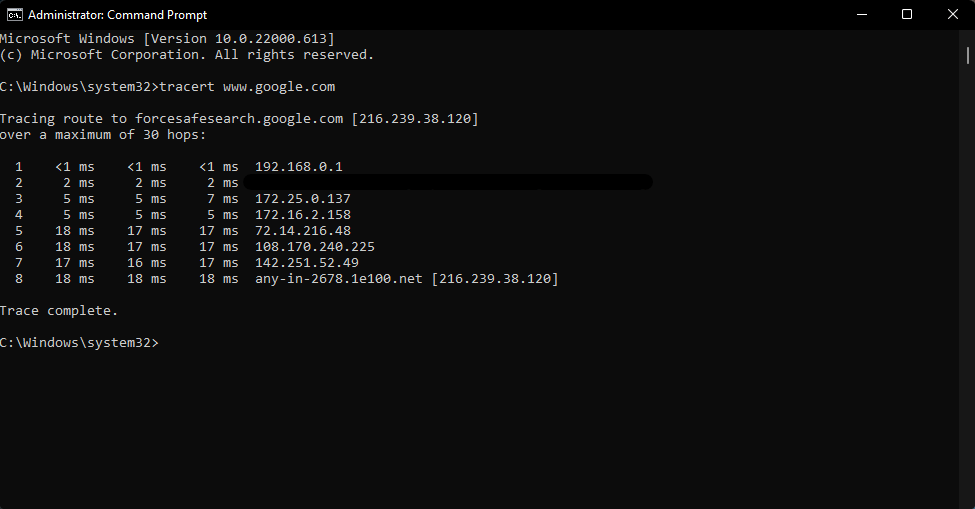
- Open the Command Prompt. Press the Windows key, type cmd, and hit Enter.
- Type tracert followed by the destination domain or IP address you want to trace:
tracert google.com
The trace results will begin to display, showing the path your connection takes to the destination.
You can also use several options to modify the command’s behavior. Here are the most common flags for tracert:
| Flag | Description |
| -d | Prevents tracert from resolving IP addresses to hostnames. Using this option results in a much faster trace. |
| -h <number> | Specifies the maximum number of hops to search for the target. The default is 30. |
| -w <number> | Sets the timeout in milliseconds to wait for each reply before the connection is considered lost. |
| -4 | Forces the command to use only IPv4. |
| -6 | Forces the command to use only IPv6. |
After learning how to run a trace on different operating systems, the next step is to understand what the results actually mean.
How to read traceroute results
After running the command, your terminal will display the results line by line. While the visual output can vary slightly between operating systems, the core information – the path your data travels – remains the same.
A traceroute report lists every hop a data packet takes to reach its destination. Each line represents one of those hops.
To make sense of the report, you first need to understand what each part of the output means.
What do traceroute columns mean?
Each row in the report is typically divided into three main sections, providing specific details about that step in the journey. Let’s break down a single line from a sample output:

| Component | Example | Description |
| Hop number | 2 | The first number simply counts the hop in the sequence. Here, 2 indicates that it is the second router in the path. |
| Hostname/IP address | 153.92.2.11 (153.92.2.11) | This display the domain name (if available) and IP address of the router at that hop. |
| Round-trip time | 0.952 ms 0.488 ms 0.195 ms | These three times show how long each of the three packets took to get to the hop and return, measured in milliseconds (ms). |
How to identify errors in a traceroute report
Sometimes, a traceroute doesn’t complete smoothly. When issues occur, the report will display specific indicators instead of the usual RTT times.
Here are the most common errors and what they mean:
- Asterisks (*). This symbol means a packet sent to that hop was not returned in time. This often indicates network congestion or a firewall blocking the request. One or two asterisks are common, but three in a row signal a potential problem.
- “Request timed out”. This is the Windows equivalent of the asterisk and means the server at that hop did not respond. This could be due to network congestion, a firewall, or an issue with the return path.
- “Destination net unreachable”. This message indicates that the packets can no longer find a route to the destination. This usually points to a router configuration issue or a broken connection path.
Next, let’s see how to analyze the patterns in the results to diagnose different types of network problems.
High latency in the middle of the trace
- What it looks like: The RTT numbers are low for the first few hops, then suddenly increase at a specific router and remain high for every hop after that. Here’s an example where latency jumps at hop 4:
1  192.168.1.1 (192.168.1.1)  1.2 ms  1.5 ms  1.4 ms
2  10.0.0.1 (10.0.0.1)  15.1 ms  14.8 ms  15.2 ms
3  203.0.113.1 (203.0.113.1)  16.0 ms  15.9 ms  16.1 ms
4  198.51.100.1 (198.51.100.1)  155.4 ms  155.2 ms  155.8 ms
5  domain.tld (192.0.2.1)  156.1 ms  155.9 ms  156.0 ms
- What it means: This pattern points to a bottleneck or congestion issue at the router where the latency first jumped. The problem is located on the network of an ISP or a major internet backbone provider.
- What to do: There is little you can do directly, as the issue is outside your local network. However, if the problem persists, you can report it to your ISP and provide the traceroute results as evidence.
High latency at the beginning of the trace
- What it looks like: The RTT numbers are very high on the first or second hop. A healthy connection to your local router (the first hop) should typically be under 5 ms. In the example below, the latency is over 180 ms from the start, indicating an immediate problem.
1  192.168.1.1 (192.168.1.1)  180.1 ms  182.3 ms  181.5 ms
2  10.0.0.1 (10.0.0.1)  185.2 ms  184.9 ms  185.4 ms
3  domain.tld (192.0.2.1)  190.5 ms  191.1 ms  190.8 ms
- What it means: This almost always indicates a problem with your local network. The slowdown is happening between your computer and your router.
- What to do: Troubleshoot your local hardware. Start by rebooting your router. If that doesn’t work, check your network cables for damage or try connecting via a different method, like from WiFi to an Ethernet cable.
Timeouts in the middle of the trace
- What it looks like: One of the hops in the middle of the report shows three asterisks (* * *) or a “Request timed out” message, but the hops after it respond normally.
1  192.168.1.1 (192.168.1.1)  1.2 ms  1.5 ms  1.4 ms
2  10.0.0.1 (10.0.0.1)  15.1 ms  14.8 ms  15.2 ms
3  * * *
4  198.51.100.1 (198.51.100.1)  16.4 ms  16.2 ms  16.8 ms
5  domain.tld (192.0.2.1)  17.1 ms  16.9 ms  17.0 ms
- What it means: This is usually not a problem. It simply means that a router along the path is configured not to respond to traceroute requests.
- What to do: You can safely ignore this. As long as the trace continues and reaches the destination, the connection is flowing through that router correctly.
Timeouts at the end of the trace
- What it looks like: The trace works perfectly until the very last few hops, which time out completely.
1  192.168.1.1 (192.168.1.1)  1.2 ms  1.5 ms  1.4 ms
2  10.0.0.1 (10.0.0.1)  15.1 ms  14.8 ms  15.2 ms
3  203.0.113.1 (203.0.113.1)  16.0 ms  15.9 ms  16.1 ms
4  * * *
5  * * *
- What it means: The most common cause is a firewall on the destination server that is blocking the traceroute packets.
- What to do: This is often not an error, as long as you can still access the website or service. If you can’t connect at all, you may need to contact the website’s administrator. Or, if you are the website owner, check your server firewall configuration or reach out your hosting provider for support.

Key takeaways
The traceroute command is your go-to tool for diagnosing the path and performance of your network connection. When you run a trace, you should expect to see a hop-by-hop list of routers with corresponding latency times.
Look for patterns in these results: a sudden jump in latency points to a bottleneck, while timeouts can indicate a firewall or a router that doesn’t respond to requests.
By understanding these patterns, you can quickly determine if a network problem is on your end, with an ISP, or at the destination server.
If you’re managing servers or troubleshooting home networks, traceroute should be your first stop.

Pras has a background in IT education and experience as a website administrator, he hopes to share his knowledge with other tech enthusiasts. In his free time, Pras likes to play video games.

Ariffud is a Technical Content Writer with an educational background in Informatics. He has extensive expertise in Linux and VPS, authoring over 200 articles on server management and web development. Follow him on LinkedIn.