What is New Relic, how it works, and why use it for infrastructure monitoring
Dec 02, 2025
/
Aris S.
/
8 min Read
If you own any web application or a site, it is crucial to keep its load time optimal. A slow web page can leave customers unsatisfied, negatively impacting your business.
However, as web applications become more complex, it is difficult to monitor their performance. This is due to several factors, such as the web hosting server, external services, and other applications.
Therefore, some developers use New Relic to help with this task. New Relic is a monitoring tool that tracks web applications’ performance metrics and other data.
Such tools provide essential information to help you quickly pinpoint any performance issues. This allows for more efficient troubleshooting, potentially reducing your site maintenance costs.
This article will explain all about New Relic, including how it works and its benefits. You will also learn how to install New Relic and use it to track your web app performance.

What Is New Relic?
New Relic is a web-based software used for full-stack monitoring. It allows you to monitor applications, infrastructure, web browsers, and other components on a single platform.
This tool tracks and provides your web application performance details in real time. Developers can analyze them to understand what causes the performance issues.
Among its many services, New Relic is most famous for its application performance monitoring (APM). As a software-as-a-service (SaaS), you can fully utilize its features via the web browser.
New Relic supports many different languages, including PHP, Java, Python, and Ruby. You can also integrate it with a cloud service like Microsoft Azure or Amazon Web Services.
How New Relic Works
To understand how New Relic works, you must know the four data types it uses for monitoring. Shortened as MELT, they are:
- Metrics – a numeric measurement of your app performance. This includes load time, CPU usage, and memory consumption.
- Events – describes activities running within your application and consists of multiple lines of log data.
- Logs – a detailed record of an event. It describes every step occurring in an application and labels them with a time stamp.
- Traces – shows a sequence of events. This data provides information about how your app operates chronologically.
New Relic uses an agent – a short code installed within your web app or virtual private server. This agent gathers different performance data by instrumenting your web app at the code level.
Every monitoring task requires a dedicated agent. For instance, there are three separate agents for application, infrastructure, and browser monitoring.
New Relic will retrieve the data from the agent and display it on the dashboard. Users can pinpoint the data to determine what causes the performance issue and resolve it immediately.
What Can New Relic APM Be Used For?
This section will explain how to use New Relic’s features to improve your web app development effort.
Important! APM may also describe application performance management tools. In this case, it stands for application performance monitoring.
Monitoring
New Relic APM offers a unified monitoring functionality that tracks your web apps and microservices. It provides code-level analysis of your application for precise troubleshooting.
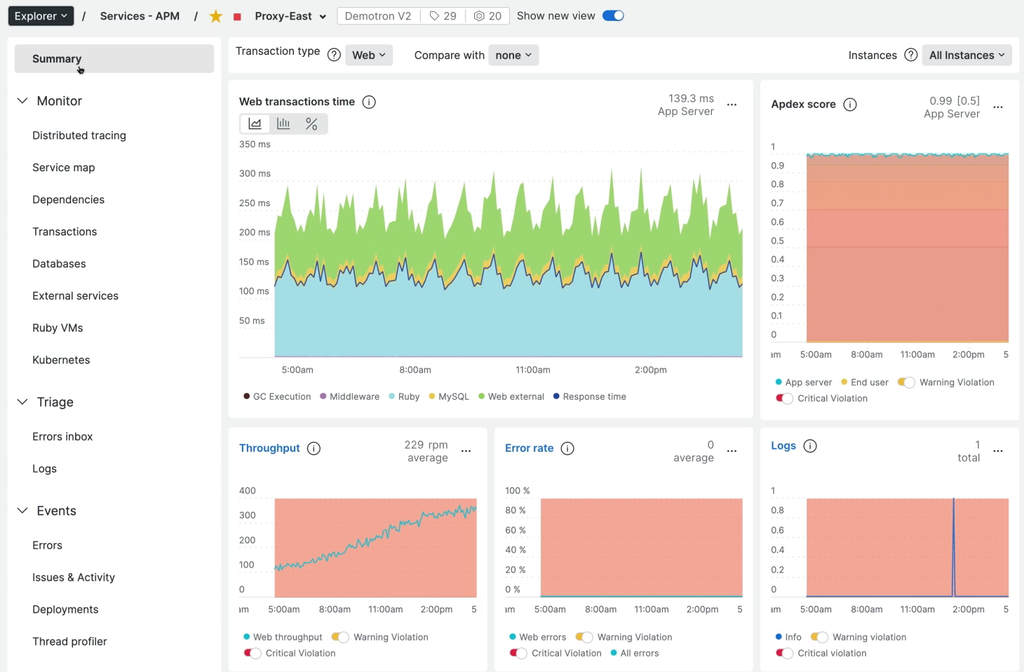
For simpler monitoring, examine the general overview of your web application performance via the APM Summary page. Here, you can see important performance metrics such as:
- Transaction response time – the transaction duration from the requester’s end. This metric doesn’t reflect the total time spent on a transaction.
- Apdex score – the ratio of satisfactory and unsatisfactory response time based on the predetermined threshold. This metric is used to measure user satisfaction for website usability testing.
- Throughput – users’ activity in a particular application. It is measured in requests per minute (RPM).
- Error rate – the percentage of transactions returning errors relative to the total number during a specific time interval. In New Relic, unhandled exceptions typically trigger such errors.
- Used host resources – the host server hardware usage, such as CPU and memory consumption.
Important! In New Relic APM, transactions commonly refer to activities that begin when the application receives HTTP requests and end when it sends responses.
Aside from APM Summary, there are other pages for different monitoring purposes:
- Distributed tracing – records traces’ durations, errors, paths, and span count.
- Transactions – lists requests, top transactions by wall-clock time percentage, relevant throughput, and server resources usage.
- Kubernetes – displays deployment age, available pods, pod log, and metric comparison.
- Databases – shows database transactions, operations, throughputs, and response times.
- External services – details upstream and downstream entities’ throughput, response time, and error rate.
New Relic APM can also gather metrics from external environments. Its external service metrics provide information about cloud resources and network traffic.
Reporting and Alerting
New Relic APM has a service level agreement (SLA) reporting feature that tracks your application’s uptime, downtime, and trends over time. Such information provides insights into its end-user performance.
The SLA report is available daily, weekly, or monthly depending on your account settings. You can view the report directly on the APM or download it as a CSV file.
It also offers an alerting feature that notifies about the web app’s performance anomalies. It automatically alerts you when specific metrics fall below the threshold based on your custom criteria.
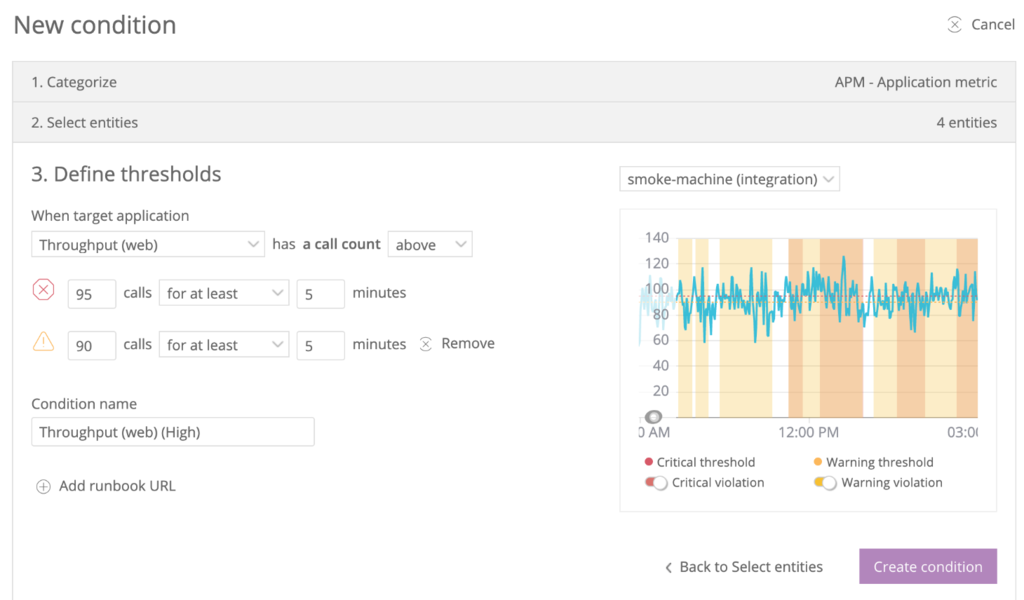
You may customize different conditions to create customized alerts, namely:
- Monitored data source. Choose the application components you wish to be alerted about. For a more complex application architecture, you can create alerts for multiple components
- Violating behavior. Define how the data can trigger the violation, such as when it falls below the threshold.
- Incident preference. Set how you want to be notified about the issues. For instance, you may choose to be notified only when recurring violations occur.
- Notification methods. Select how you want to be notified. It may be via email, OpsGenie, Slack, or other supported notification channels.
This alerting feature also uses the Applied Intelligence engine that provides a detailed root cause analysis.
Building Dashboards
New Relic’s dashboard gathers and displays web application performance information on a single screen. Its visual, color-coded graph helps simplify monitoring tasks.
It also allows you to create your own personalized dashboard. You can customize its layout, resize the chart, and change the displayed information according to your needs.
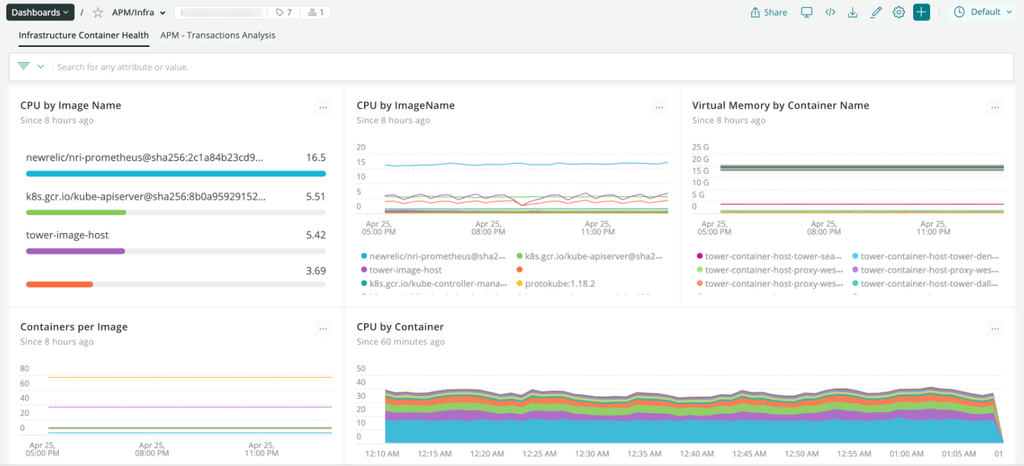
New Relic also lets you create multiple dashboards for different purposes. For example, create two dashboards to monitor application performance in two different countries. You can also share your dashboards with other teams to improve collaboration workflow.
Checking Traces and Backlogs
New Relic lets you check the transaction traces and logs. Both data are essential to understand the root cause of your app’s performance issues.
Traces and logs give you precise records of errors occurring on your application. It is difficult to fix performance issues without them due to a lack of information.
New Relic APM traces record your entire application’s transaction and database calls in detail. You can drill down these transaction traces to determine which services slow the application down the most.
The platform allows you to see the log messages associated with the transaction traces. You can search the relevant records by entering related keywords into the Logs UI.
Combining these two pieces of information allows you to accurately troubleshoot errors faster.
New Relic Benefits
New Relic provides various benefits that other monitoring tools lack, including:
- Simple setup. New Relic offers comprehensive documentation regarding the installation process. Moreover, its guided installation automatically detects your environment and setups the agent accordingly.
- Ease of use. New Relic’s dashboard allows you to monitor your web app’s data on a single screen. You can also inspect the data to pinpoint the root cause of found errors in a few clicks.
- Customer error logging. New Relic records and creates logs for customer errors. It displays different attributes to give you more context for troubleshooting.
- Transaction racking. You can preview which of your application’s components takes the most time to load.
- Intuitive user interface. New Relic UI has a well-designed layout and visual elements. Its customizability also makes the UI suit every type of user, even newcomers.
How to Install New Relic APM
You will need to install a different agent depending on what you want to monitor. For instance, performing application monitoring requires a New Relic APM agent.
Its APM agents are available for various popular programming languages. The installation process may differ depending on the languages and your operating systems.
Important! Before installing the APM agent, ensure your system meets the minimum requirements. Also, you must have root access to the system.
This tutorial will show you how to install the PHP APM agent on a compatible Ubuntu system.
First, register a New Relic account. Then, do the following steps:
- After logging in, click on your profile icon → Account settings, and copy your license key.
- Run the Terminal and enter the following code to configure the New Relic repository:
echo 'deb http://apt.newrelic.com/debian/ newrelic non-free' | sudo tee /etc/apt/sources.list.d/newrelic.list
- Verify the source authority by executing the following:
wget -O- https://download.newrelic.com/548C16BF.gpg | sudo apt-key add -
- Update the local package list using this command:
sudo apt-get update
- Enter this command to install the PHP agent from the repository:
sudo apt-get install newrelic-php5
- Skip this step if the installation process runs normally. Otherwise, the Terminal may return the “Please run newrelic-install as root to complete installation” error message. If this is the case, manually install the package using the following command:
sudo newrelic-install install
- Enter your web application’s name and license key.
- Restart the web server to finish the installation process. The commands differ depending on your web server. For instance, run the following if you use Apache 2:
sudo service apache2 restart
New Relic recommends you try using your web application after the installation to generate some pieces of data. This measure aims to verify if the agent works properly.
We recommend using its guided installation method if you don’t plan to deploy at scale. It automatically detects your system’s compatibility and guides you through the installation process.
How to Use New Relic
Developers can start using New Relic right after installation completes and view the retrieved data immediately without performing additional setups.
To view the performance report, log in to your account → APM tab, and select the desired application. You will see the dashboard displaying your application’s performance data.
You can use this data for several tasks, such as troubleshooting performance issues. Here is an example workflow of such a task:
- On the dashboard, check the Apdex score graph. If it falls below the threshold, your web application is underperforming.
- Find a spike on the Web transactions time graph. Each color represents different web transaction components, such as database query, external service, or code execution.
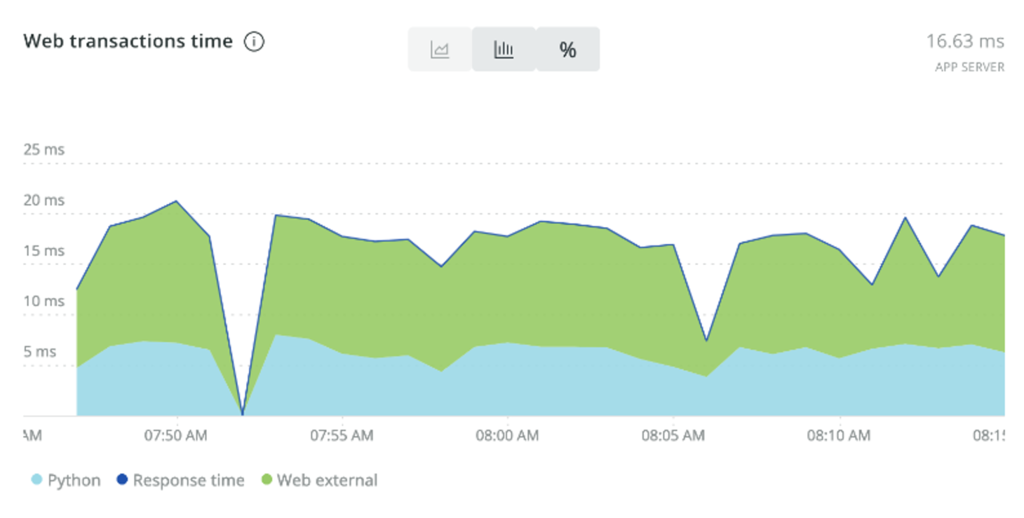
- Click the graph with the largest spike to get more detailed information.
- You will be redirected to a different screen depending on what you click. In this case, it is the Transactions page.
- Sort the transactions by the Apdex most dissatisfying to see which one affects the score the most. Click the one on the top.
- Scroll down to the Transactions traces section. Click one of the transaction traces.
- Click the Trace details tab and find the segment highlighted in red or yellow.
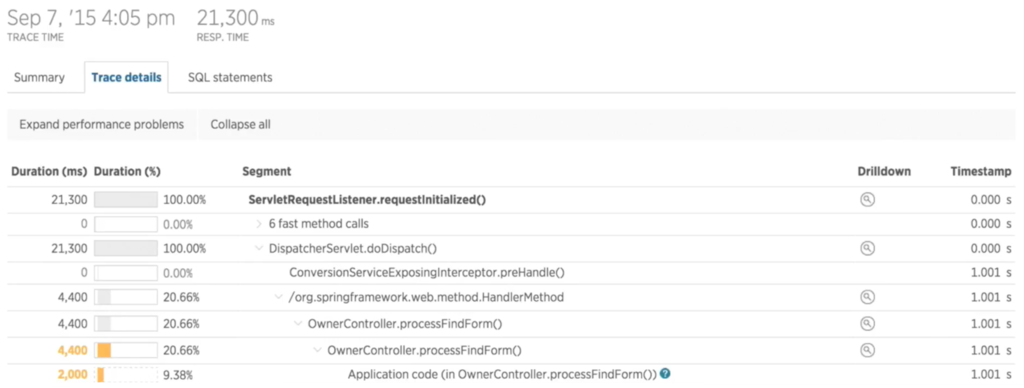
- Analyze if this segment’s timing is sufficient based on your criteria. If not, the segment may be the culprit.
Conclusion
New Relic is a real-time monitoring tool that tracks and provides information about your web app performance. It helps you quickly catch and fix any performance issues more efficiently.
New Relic works using an agent – code installed in your infrastructure or app that tracks their performance. This agent will gather and send important data to the dashboard for users to examine.
Aside from monitoring, New Relic is also useful for reporting and alerting, building dashboards, and checking traces and backlogs. You can drill down each data graph to get better insights into issues happening on your system.
Its simplicity and features make New Relic a popular APM solution. Moreover, it is easy to install and works immediately without additional setup.
What Is New Relic: FAQ
This section will answer some commonly asked questions about New Relic. If yours remain unanswered, leave a comment below.
Is New Relic a DevOps Tool?
Yes. DevOps engineers utilize New Relic to monitor web apps’ performance after deploying new changes. Suppose any changes impact performance, and they will immediately fix it.
How Does New Relic Collect Data?
New Relic collects data using an agent. It is a piece of software installed within your application or host server that gathers performance data.
The agent instruments your application at the code level to gather the data. It collects the information for one minute before sending it to the APM dashboard.
What Is the Difference Between Splunk and New Relic?
Both Splunk and New Relic are web application monitoring tools. However, New Relic is a cloud-based tool, whereas Splunk is available in cloud and on-premise deployment.
Also, New Relic is commonly used to monitor apps and their host server performance. Meanwhile, Splunk is more focused on log management functionality and security.

Aris is a Content Writer specializing in Linux and WordPress development. He has a passion for networking, front-end web development, and server administration. By combining his IT and writing experience, Aris creates content that helps people easily understand complex technical topics to start their online journey. Follow him on LinkedIn.

Comments
0 responses