How to connect WooCommerce with Google Analytics using a plugin
Mar 10, 2026
/
Ariffud M.
/
8 min Read
WooCommerce Google Analytics integration connects your online store to Google’s tracking platform, enabling you to monitor conversions, product performance, and customer behavior.
Store owners use this data to identify top-selling products, find checkout drop-offs, and measure how well their marketing campaigns perform.
Connecting WooCommerce with Google Analytics 4 (GA4) takes four steps:
- Create a GA4 property and copy your Measurement ID.
- Install and activate the official Google Analytics for WooCommerce plugin.
- Configure tracking options, including the global site tag, purchase transactions, and add-to-cart events.
- Verify data collection using GA4 Realtime reports or Google Tag Assistant.
Once everything’s active, you can track metrics like conversion rates, add-to-cart events, and revenue by traffic source, all from your GA4 dashboard.
1. Set up your Google Analytics account
When using Google Analytics, you’ll in fact use Google Analytics 4 – the current and only supported version. Universal Analytics stopped processing data on July 1, 2023, so all new setups use GA4 by default.
Without a properly configured GA4 property, the WooCommerce plugin has nowhere to send tracking data. Complete this step before you install any plugins.
Follow these steps to create your GA4 property and get your Measurement ID:
- Go to analytics.google.com and sign in with your Google account.
- Click Start measuring on the welcome screen.
- Enter an Account name. Your business name works well. Configure the data sharing settings, then click Next.
- Enter a Property name, usually your store name. Select your time zone and currency, then click Next.
- Choose your business industry and business size, then click Next.
- Select your business objectives and click Create.
- Choose Web as the data stream source.
- Enter your store URL (for example, https://domain.tld) and a stream name. Click Create stream.
- Copy the Measurement ID. It starts with G- followed by letters and numbers, like G-ABC123XYZ.
If you already have a Google Analytics account, go to Admin → Create → Property and follow steps 4 through 9 above.
You’ll find your Measurement ID at the top of the Web stream details page. You can also access it later by going to Admin → Data collection and modification → Data streams → [your stream] → Measurement ID.
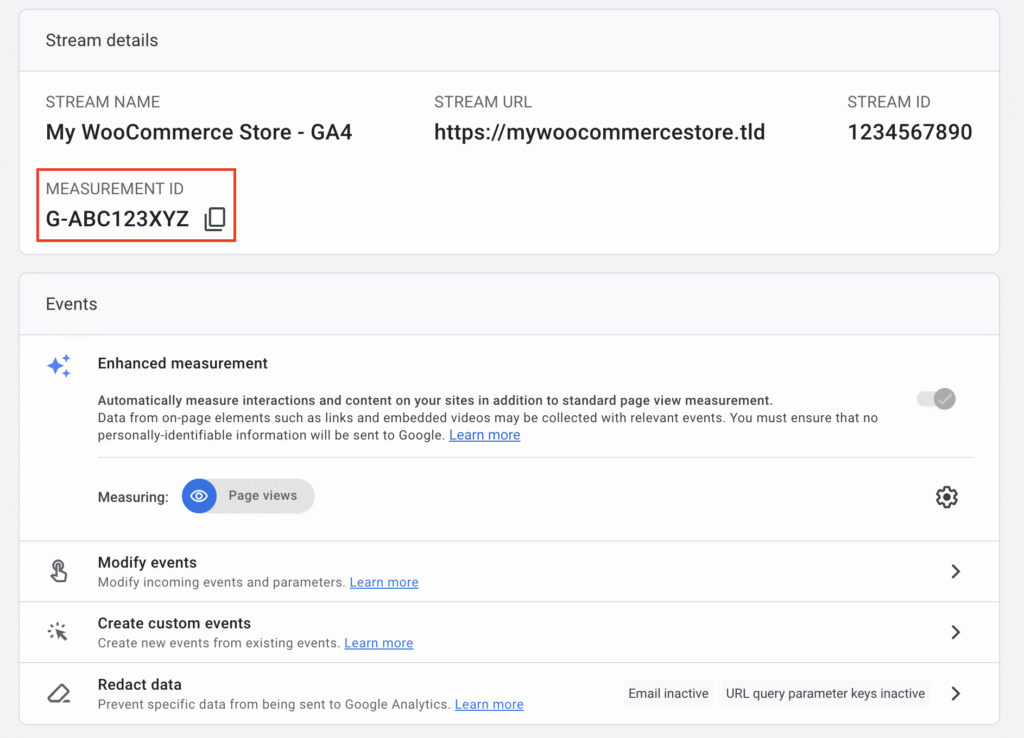
Keep this ID handy since you’ll need it during plugin setup.
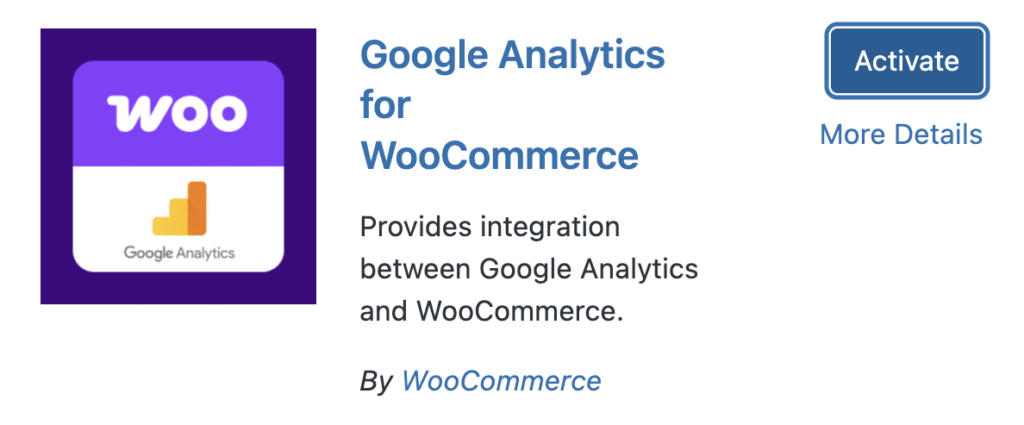
2. Install the WooCommerce Google Analytics plugin
Google Analytics for WooCommerce is the official free plugin for connecting GA4 to your store. WooCommerce (part of Automattic) maintains it, and you can find it on WordPress.org, where it has over 200,000 active installations.
Using the official plugin helps ensure compatibility with WooCommerce updates and gives you access to support from the WooCommerce team.
Here’s how to install the plugin from your WordPress dashboard:
- Log in to your WordPress admin area.
- Go to Plugins → Add new plugin.
- Search for Google Analytics for WooCommerce.
- Click Install now on the plugin.
- Click Activate once the installation finishes.
You can also install the plugin manually by uploading a ZIP file:
- Download the plugin from the Google Analytics for WooCommerce page.
- In your WordPress dashboard, go to Plugins → Add new plugin.
- Click Upload plugin → Choose file.
- Select the downloaded ZIP file and click Install now.
- Click Activate after the upload finishes.
A Pro version is available for $79 per year and includes features like user ID tracking, detailed checkout step events (payment method selected, billing email provided), coupon tracking, and order refund/cancellation monitoring.
For most stores, the free version covers standard ecommerce tracking needs. If you’re unsure which one to choose, you can compare both versions on the WooCommerce Google Analytics comparison page.
3. Configure the plugin settings
Access the plugin settings by going to WooCommerce → Settings → Integration → Google Analytics in your WordPress dashboard. Enter your Measurement ID in the Google Analytics Tracking ID field.
Configure the tracking options based on your store’s needs:
- Display Advertising Support. Enables remarketing features and demographic reports in GA4. Turn this on if you run Google Display Network ads or want audience insights like age, gender, and interests. This is optional but useful for advertising campaigns.
- Track 404 (Not found) Errors. Logs visits to broken or missing pages as events in GA4. This helps you find dead links and unavailable product pages so you can fix or redirect them. It’s recommended for maintaining site health.
- Accept Incoming Linker Parameters. Allows cross-domain tracking by accepting linker parameters from other websites. Enable this if you use multiple domains, such as a separate checkout domain, and need to track users across them. This is optional for single-domain stores.
- Purchase Transactions. Tracks completed orders, including product details and revenue. This sends purchase data to GA4 when customers reach the thank-you page. It’s required for ecommerce reporting. Some payment gateways redirect users off-site, such as certain PayPal setups, which may prevent this event from firing.
- Add to Cart Events. Records when customers add products to their carts. This is important for understanding purchase intent and identifying which products attract the most interest.
- Remove from Cart Events. Tracks when customers remove items from their carts. This helps identify products that customers reconsider, or pricing issues that cause drop-offs. It’s recommended for detailed cart behavior analysis.
- Product Impressions from Listing Pages. Records when products appear on category, shop, or search results pages. This is useful for measuring product visibility and comparing impressions with clicks. It’s optional but helpful for optimizing product placement.
- Product Clicks from Listing Pages. Tracks when customers click a product from a listing page. When combined with impression data, this shows click-through rates and highlights products that attract attention. Enable this if you track product impressions.
- Product Detail Views. Logs when customers view individual product pages. This shows which products attract interest before customers add them to their carts. It’s recommended for full funnel tracking.
- Checkout Process Initiated. Records when customers start the checkout process. This marks the beginning of the checkout funnel and helps you measure how many cart additions turn into checkout attempts. It’s recommended for identifying checkout abandonment.
Click Save changes once you finish configuring the options.
Note that the Pro version includes additional tracking for events like coupon usage, customer account activity, payment method selection, and order refunds.
If you’re using another Google Analytics plugin, like MonsterInsights, follow that plugin’s documentation for configuration steps.
4. Test your WooCommerce Google Analytics integration
GA4 can take 24 to 48 hours to display data after the initial setup. Reports won’t populate right away, so check again the next day if you see zeros across the board.
You can verify that tracking works using two methods.
Use GA4 Realtime reports:
- Open your GA4 property.
- Go to Reports → Realtime overview.
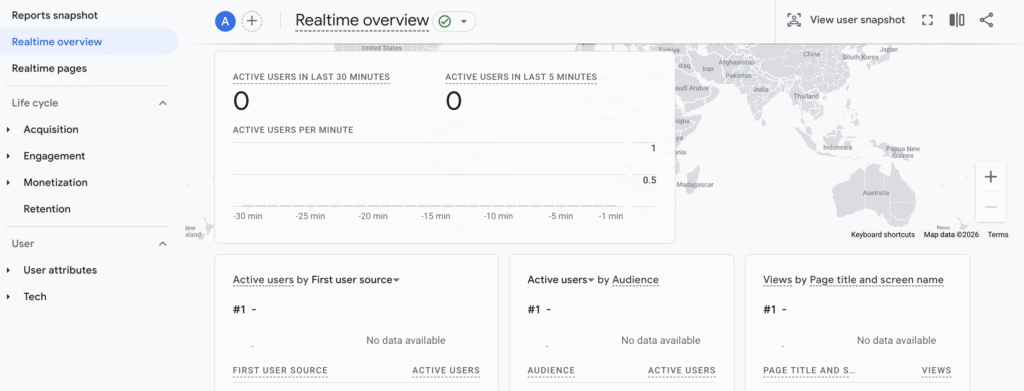
- Open your store in a new browser tab or an incognito window.
- Browse a few products and add one to your cart.
- Check the Realtime report. You should see your activity appear within seconds.
Use Google Tag Assistant:
- Install the Google Tag Assistant Chrome extension.
- Visit your store and click the extension icon.
- Look for your GA4 Measurement ID with a green checkmark, which confirms proper installation.
If tracking doesn’t work as expected, check these common issues:
- Mistyped Measurement ID. Double-check that the ID in your plugin settings matches the one shown in GA4. The format starts with G- followed by letters and numbers.
- Plugin not activated. Go to Plugins → Installed plugins and confirm that Google Analytics for WooCommerce is active.
- Cache plugins interfering. Clear your site and CDN caches using your caching tools, such as WP Super Cache, W3 Total Cache, or Cloudflare, after you enable tracking.
- Global site tag disabled. Return to the plugin settings and ensure Use global site tag is enabled.
- Theme or plugin conflicts. Temporarily switch to a default theme, such as Storefront, and disable other plugins to identify conflicts.
Your integration works correctly when GA4 shows active users, page views, and ecommerce events like add_to_cart and purchase.
In the Realtime report, you’ll also see user locations, active pages, and events as you browse your store.
Key WooCommerce metrics to monitor in Google Analytics
GA4 tracks dozens of metrics for WooCommerce stores.
To understand store performance and customer behavior, focus on these six categories: conversion rate, add-to-cart and checkout behavior, purchase volume and revenue, user retention, device and browser performance, and geographic performance.
Conversion rate
Conversion rate measures the percentage of visitors who complete a purchase out of the total number of sessions. For example, a store with 1,000 sessions and 30 purchases has a 3% conversion rate.
This metric helps you separate high-quality traffic from casual browsers. If a paid ad campaign drives lots of visitors but few sales, it often points to targeting issues or weak landing pages.
Track conversion rate by traffic source by going to Reports → Acquisition → Traffic acquisition. This helps you identify channels that bring in buyers, not just visitors. Invest more in sources with above-average conversion rates.
Add-to-cart and checkout behavior
Add-to-cart events show how many visitors add products to their carts. Checkout data reveals where customers drop off, such as during shipping details, payment entry, or order review.
High add-to-cart rates combined with low checkout completion usually indicate friction in the checkout flow. Common issues include unexpected shipping costs, forced account creation, or too many form fields.
Use this data to prioritize improvements to the checkout process. If 60% of customers abandon the shipping step, test free shipping thresholds or show shipping costs earlier in the process.
Purchase volume and revenue
Purchase volume counts completed orders, while revenue shows total sales value by product, category, or time period.
These metrics answer core business questions, such as how much your store sells, which products generate the most revenue, or whether sales grow month over month.
Compare revenue with traffic levels to spot opportunities. A product page with strong traffic but weak sales may need better images, clearer descriptions, or pricing adjustments.
User retention
User retention measures how many first-time visitors return within a specific period, like 7 or 30 days. GA4 retention reports compare new and returning users.
Returning customers cost less to convert than new ones. High retention usually signals customer satisfaction and effective email marketing or retargeting.
Low retention can point to issues with product quality, site experience, or post-purchase communication. Use these insights to improve follow-up emails, loyalty programs, or product recommendations.
Device and browser performance
Device reports break down traffic by mobile, desktop, and tablet. Browser reports show which browsers your customers use, such as Chrome, Safari, or Firefox.
Large conversion rate gaps across devices often reveal usability problems. If desktop converts at 4% but mobile converts at 1%, your mobile checkout experience likely needs attention.
Browser-specific issues can also hurt sales. For example, a broken payment form in Safari can stop customers from completing purchases. Review conversion rates by browser each month to catch issues early.
Geographic performance
Geographic reports show the countries, regions, and cities of visitors. You can also review conversion rate, revenue, and session duration by location.
Location data helps guide marketing decisions. High traffic from Germany with low conversions may indicate a need for German-language product pages or euro pricing.
Use geographic insights to prioritize new markets, refine ad targeting, and adjust currency or shipping options for regions with strong potential.
What are the benefits of using Google Analytics with WooCommerce?
Connecting GA4 to your WooCommerce store turns raw traffic into actionable insights. Store owners use this data to make smarter decisions and increase sales in several key ways.
- Identify top-performing products and double down. GA4 shows which products generate the most revenue, have the highest conversion rates, and deliver the strongest margins. You can feature these products on your homepage and category pages to maximize visibility. For example, if one product line drives 40% of total revenue, you can prioritize restocking, create bundles, and build marketing campaigns around those items.
- Spot checkout abandonment and fix friction points. Checkout funnel reports show exactly where customers drop off during the purchase process. If 50% of users leave at the shipping step, test options like guest checkout, address autofill, or more transparent shipping cost displays. Even a single improvement at a high drop-off point can recover significant lost revenue.
- Measure marketing return on investment by channel. GA4 attributes revenue to traffic sources such as organic search, paid ads, social media, email, and direct traffic. Instead of guessing which campaigns work, you see how much revenue each $100 in ad spend generates. Use this data to shift the budget away from channels with high acquisition costs and toward those that bring in profitable customers.
- Understand customer behavior patterns. Event tracking shows how visitors move through your store. You can see whether they land on product pages and leave right away, or browse multiple categories before buying. These insights guide decisions about site structure, product placement, and navigation design.
- Create targeted remarketing audiences. GA4 integrates with Google Ads so you can build audiences based on behavior. You might target visitors who viewed a product but didn’t buy, customers who haven’t purchased in 90 days, or high-value shoppers for VIP promotions. Behavior-based targeting often outperforms broad demographic targeting because it focuses on people who have already shown interest.
- Benchmark performance over time. Monthly and yearly comparisons help you understand whether your store is growing. If revenue increases 20% year over year while traffic grows only 5%, your conversion rate is improving. If traffic doubles but revenue stays flat, you likely have a conversion issue. Benchmarks replace gut feelings with clear performance trends you can track and act on.
How to optimize your WooCommerce store for SEO
Analytics data helps you spot opportunities, but search engine optimization (SEO) drives the traffic that makes those opportunities possible.
A well-optimized WooCommerce store ranks higher in search results and attracts more organic traffic. That traffic can turn into customers without relying on paid ads.
Optimizing a WooCommerce store for SEO covers three main areas: technical setup, on-page optimization, and content strategy.
Technical setup includes sitemaps, schema markup, and site speed. On-page optimization focuses on product titles, descriptions, and image alt text. Content strategy involves blog posts, category page copy, and FAQ sections.
Each of these elements helps search engines understand your store and match it with relevant search queries.
All of the tutorial content on this website is subject to Hostinger's rigorous editorial standards and values.

Ariffud is a Technical Content Writer with an educational background in Informatics. He has extensive expertise in Linux and VPS, authoring over 200 articles on server management and web development. Follow him on LinkedIn.