The 12 best observability tools
Dec 17, 2025
/
Alanas M.
/
10 min Read
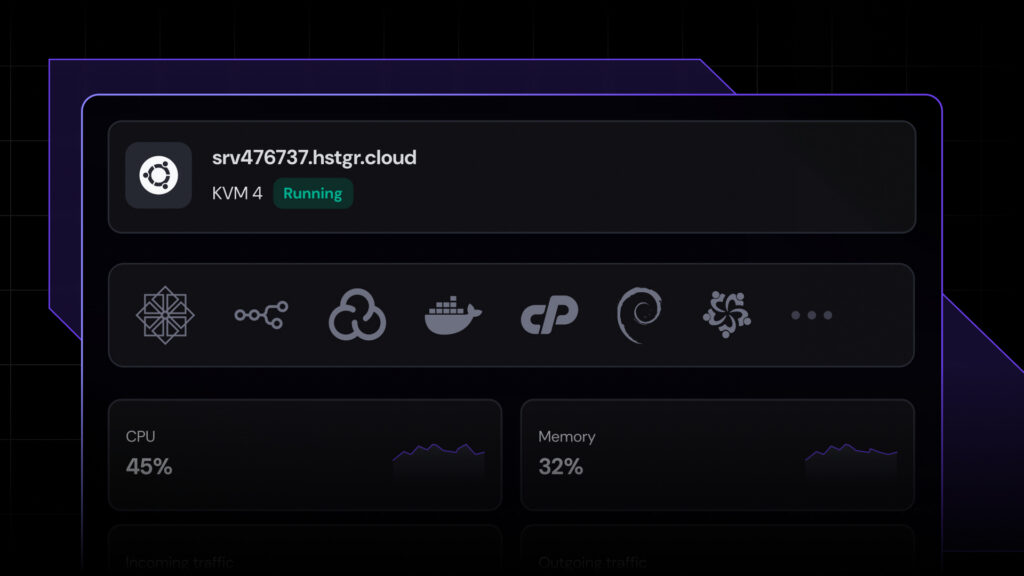
Observability tools are essential for gaining real-time insights into the health and performance of your systems. They allow you to monitor, troubleshoot, and analyze your systems with precision, helping you quickly identify and resolve issues. With the right observability tools, you can move from detecting a problem to understanding its root cause in just minutes.
This guide explores 12 of the best observability tools available today, covering everything from full-stack solutions to specialized open-source options. You’ll learn about each tool’s strengths, how it integrates into your environment, and key features to consider, so you can confidently select the best tools for your needs, stack, and budget.
What are observability tools?
Observability tools are systems that help you understand what’s happening inside your applications and infrastructure. They do this by collecting and analyzing telemetry, specifically logs, metrics, and traces. These are often called the three pillars of observability:
- Logs are timestamped records of events, including errors, warnings, requests, and system outputs.
- Metrics are numeric measurements taken over time, such as CPU usage, memory usage, or request rates.
- Traces follow individual requests as they move through different services or systems.
By examining these three pillars of data, you can get a comprehensive view of what your system is doing, how it’s performing, and most importantly, where it’s struggling or failing.
A quick overview of the best observability tools
| Tool | Type | Strengths | Best used for |
| Grafana | Visualization / Dashboarding | Highly customizable, wide plugin support, and config-as-code support | Building dashboards across diverse data sources |
| Prometheus | Metrics collection and storage | Label-based metrics, strong PromQL querying, and Alertmanager | Collecting and querying application and infrastructure metrics |
| Loki | Log aggregation via labels | Lightweight, Grafana integration, fast if labeled right | Structured logging in Grafana-based stacks |
| Datadog | Full-stack observability | All-in-one platform with rich integrations, quick to deploy | Fully managed observability with minimal setup |
| New Relic | APM + Logs + Infrastructure | Powerful query language (NRQL), flexible pricing | Developer-focused observability across apps and services |
| Dynatrace | Full-stack observability + Profiling | OneAgent with code-level insights, automation-first | Deep diagnostics in high-scale production systems |
| Splunk Observability | Managed metrics + tracing | High-resolution metrics, strong enterprise support | Large organizations have already invested in the Splunk ecosystem |
| ELK Stack | Log aggregation and analysis | Flexible ingestion, deep search, scalable storage | Full control over logs and compliance reporting |
| Netdata | Lightweight system metrics | Instant real-time insights, very low overhead | Local monitoring on servers or containers |
| Honeycomb | Event-based tracing | Handles high-cardinality tracing well, OpenTelemetry-native | Debugging complex distributed systems |
| Jaeger | Distributed tracing | Open-source, vendor-neutral, OpenTelemetry support | Self-hosted tracing for service observability |
| Zabbix | Infrastructure monitoring | Flexible alerting, SNMP, and network device support | Traditional infrastructure and network monitoring |
1. Grafana
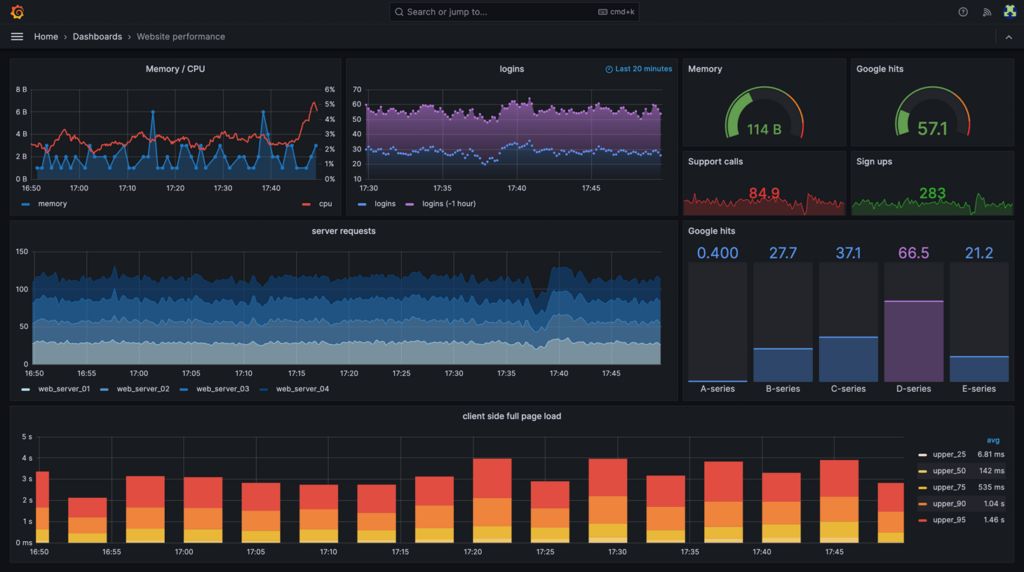
Grafana is an open-source visualization tool that turns time-series data into dashboards and alerts. It doesn’t collect or store data on its own. Instead, it connects to external sources, such as Prometheus, Loki, InfluxDB, Elasticsearch, and many others.
Think of Grafana as the front end of your observability setup. You feed it logs, metrics, or traces from other tools, and it makes them easy to explore, compare, and act upon. It supports advanced queries, templated dashboards, and alerting rules – all customizable and deployable as code.
You can run Grafana on a VPS, inside Docker or Kubernetes, or use Grafana Cloud for a managed experience. It’s lightweight and free to self-host, but you’ll need to plug in the right data sources to make it worthwhile.
What it does well:
- Connects to nearly any observability data source.
- Configuration-as-Code for dashboards and alerts.
- Clean, interactive UI with deep customization.
- Large plugin library for extended functionality.
What to consider:
- All of its power comes from the data sources you configure.
- Self-hosted setups need effort to scale, secure, and maintain.
- Building useful dashboards takes time to learn.
Grafana works best when you already have your logs and metrics sorted and simply want a tool to display that data. If you think Grafana is a great fit for you, you can follow our Grafana installation guide on a Hostinger VPS.

2. Prometheus
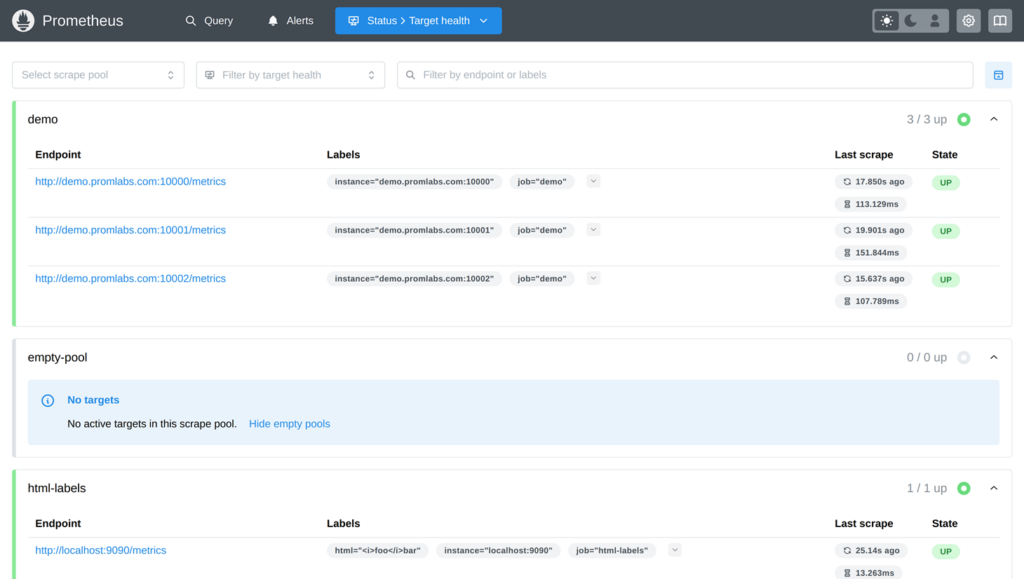
Prometheus is an open-source monitoring system designed to collect and store time-series metrics. It works by scraping metrics from endpoints that expose them in a Prometheus-compatible format, or you can send data to it through a remote write endpoint. This makes it flexible enough to monitor everything from servers to custom applications.
What sets Prometheus apart is its label-based data model. Instead of storing flat metrics, it organizes them with key-value pairs (labels), which allows you to slice and query data efficiently using its powerful PromQL language. It also comes with Alertmanager, a built-in alerting system that doesn’t require external integrations.
What it does well:
- Industry standard for collecting and storing metrics.
- Label-based structure allows for precise and efficient querying and aggregation.
- Supports both pull-based scraping and push-based ingestion via remote-write.
- Includes built-in alert manager and supports high-availability setups.
- Open source and actively maintained under the CNCF.
Things to keep in mind:
- Prometheus can be resource-hungry, especially when tracking a large number of high-cardinality metrics.
- Long-term storage isn’t handled natively; most production-grade setups extend it with tools like Thanos or Mimir.
- Scrape configurations can become tricky to manage in large or dynamic environments if not using the remote-write endpoint.
If you’re building your observability stack and are comfortable rolling up your sleeves, Prometheus is one of the most powerful tools you can deploy.
3. Loki

Loki is a log aggregation system created by the Grafana team as the logging counterpart to Prometheus. Instead of indexing full log content, Loki organizes logs using labels, much like Prometheus structures metrics. This approach keeps it lightweight and fast, though it comes with some trade-offs when it comes to flexible, full-text search.
Loki fits perfectly into a Grafana + Prometheus stack, and shines when you know ahead of time what labels to apply and what you’ll be searching for.
What it does well:
- Lightweight and low-cost log ingestion.
- Easy integration with Grafana dashboards.
- Ideal companion to Prometheus for unified observability.
Things to keep in mind:
- No full-text indexing; slow for open-ended log searches.
- Requires thoughtful labeling; poorly labeled logs are hard to query.
- Not suited for forensic or compliance-heavy log analysis.
If you already use Grafana and Prometheus, Loki is a natural extension that completes the trio. It’s a simple and efficient solution for structured, intentional logging. If you’re interested in trying it, you can follow our guide on installing Loki on a Hostinger VPS.
4. Datadog

Datadog is a fully managed observability platform that consolidates metrics, logs, traces, dashboards, and alerts into a single product. It’s built for modern infrastructure – cloud-native, containerized, and constantly changing.
If you want something that works out of the box, Datadog makes it easy. It automatically discovers services, sets up dashboards, and integrates with nearly every cloud provider or tool you can think of. You’ll spend less time configuring and more time monitoring.
Where Datadog stands out is polish. The UI is clean. The alerts are powerful. The prebuilt integrations save hours. You’ll feel productive right away. But that polish comes at a price – literally.
Key strengths:
- True all-in-one platform: metrics, logs, traces, uptime monitoring, and more.
- Built-in integration with AWS, Kubernetes, Docker, and 600+ other tools.
- Fast to deploy and useful from day one.
Considerations:
- Costs add up fast, with pricing based on per-host, per-container, and per-feature usage.
- Once you’re deeply entrenched in the ecosystem, switching away is challenging.
If your priority is ease, speed, and having everything in one place without managing your stack, Datadog delivers just that.
5. New Relic
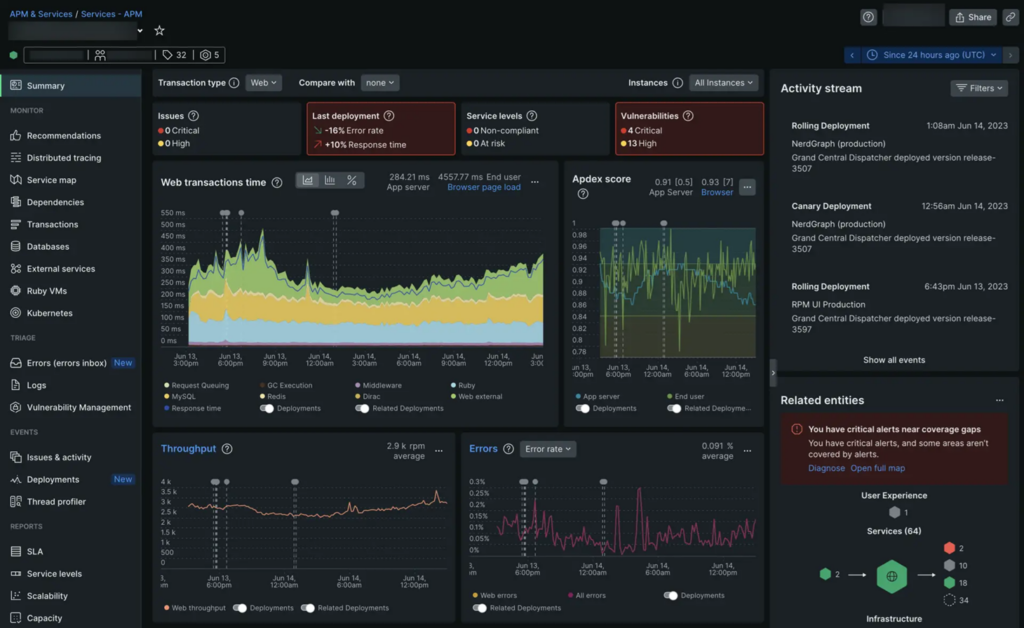
New Relic is a cloud-based observability platform that combines application monitoring, infrastructure metrics, logs, and user experience data into a single interface. It’s built to provide both high-level visibility and deep debugging capabilities, without requiring you to juggle separate tools.
Unlike most platforms that charge per host, New Relic uses a usage-based pricing model. You pay based on the amount of data you ingest and the number of users with full access. That makes it easier to roll out observability broadly across your systems and keep costs under control, if you plan your usage well.
One of its most powerful features is NRQL (New Relic Query Language), which lets you query any telemetry data in detail. You can filter, group, and slice the data however you like, but it does take some time to become familiar with it.
Key strengths:
- Combines APM, infrastructure, logs, and UX monitoring in one place.
- Usage-based billing with a generous free tier (100 GB/month).
- Advanced querying and dashboarding with NRQL.
Considerations:
- Learning curve is steep if you want to utilize its full potential.
- Data ingest costs can add up quickly if left unchecked.
If you’re looking for a single tool that gives you end-to-end visibility and fine control over your telemetry data, New Relic is a strong option.
6. Dynatrace
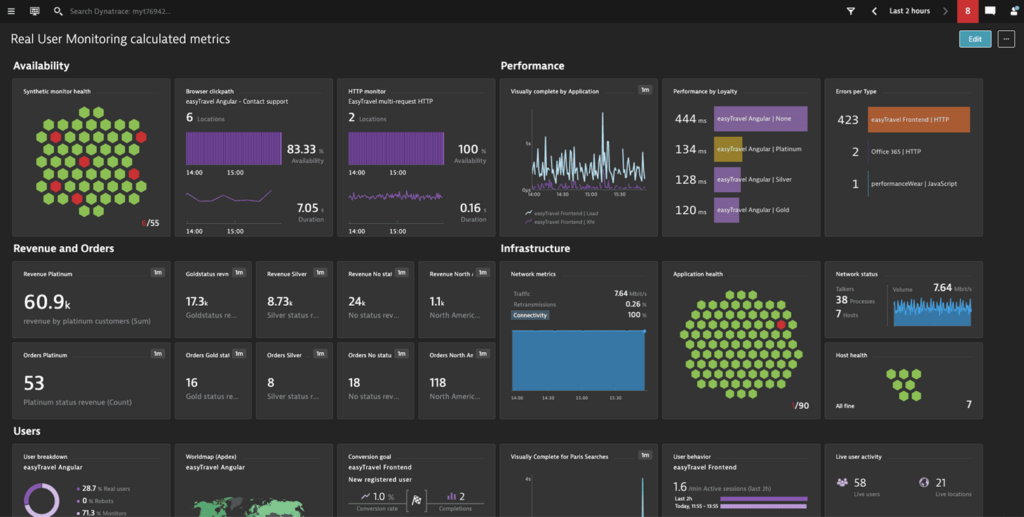
Dynatrace is a commercial observability platform focused on automation and depth. It’s designed to monitor infrastructure, applications, services, and cloud workloads with minimal manual setup, using a single agent called OneAgent.
With OneAgent installed, your stack is automatically instrumented. It starts collecting profiling data, such as CPU hotspots, slow SQL queries, and service call traces, without requiring any additional action, which makes it especially effective when you need answers quickly.
It also includes an AI engine that builds a dependency map of your system and uses that data to surface likely root causes during incidents.
What it does well:
- Extremely detailed performance profiling across code, services, and databases.
- OneAgent requires almost no manual configuration to get started.
- Automatic discovery of services, dependencies, and performance bottlenecks.
- Scales well in complex, distributed environments.
Things to keep in mind:
- Pricing is high, especially if deployed broadly across a fleet.
- It does not integrate well with other tools and is best used as a standalone solution.
- It can feel like a black box if you prefer more transparent tooling.
If you’re facing a hard-to-diagnose performance issue, Dynatrace can provide you with detailed answers quickly and accurately. It’s expensive, but you get what you pay for.
7. Splunk Observability Cloud
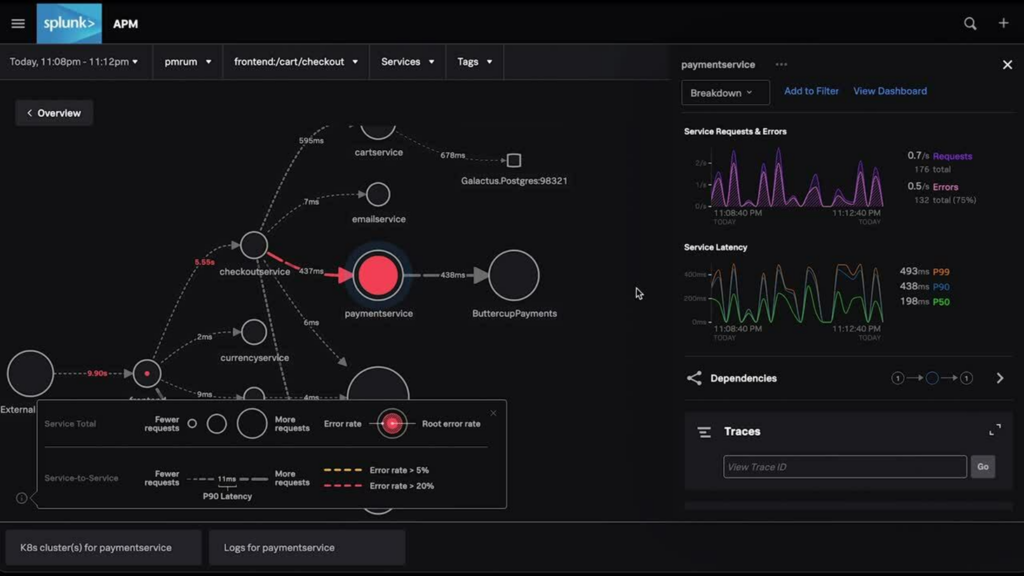
Splunk Observability Cloud is a commercial platform focused on real-time monitoring, tracing, and high-resolution metrics. It’s designed for large, fast-moving environments, with strong OpenTelemetry support and enterprise-grade features.
It’s not the same as classic Splunk used for log management. This product is aimed at observability from the ground up. But it’s most appealing if you’re already in the Splunk ecosystem. Otherwise, the learning curve and cost can be hard to justify.
What it does well:
- Real-time streaming metrics and distributed tracing.
- Designed for high-cardinality, high-volume environments.
- Strong OpenTelemetry support out of the box.
Things to keep in mind:
- Expensive, with pricing that can be hard to estimate.
- The UI can feel fragmented due to acquisitions and overlapping legacy systems.
- Most valuable when used with existing Splunk infrastructure.
If you’re already using Splunk and want full-stack observability under one vendor, this is the natural next step. It’s powerful, but not easy if you’re starting from scratch.
8. ELK Stack
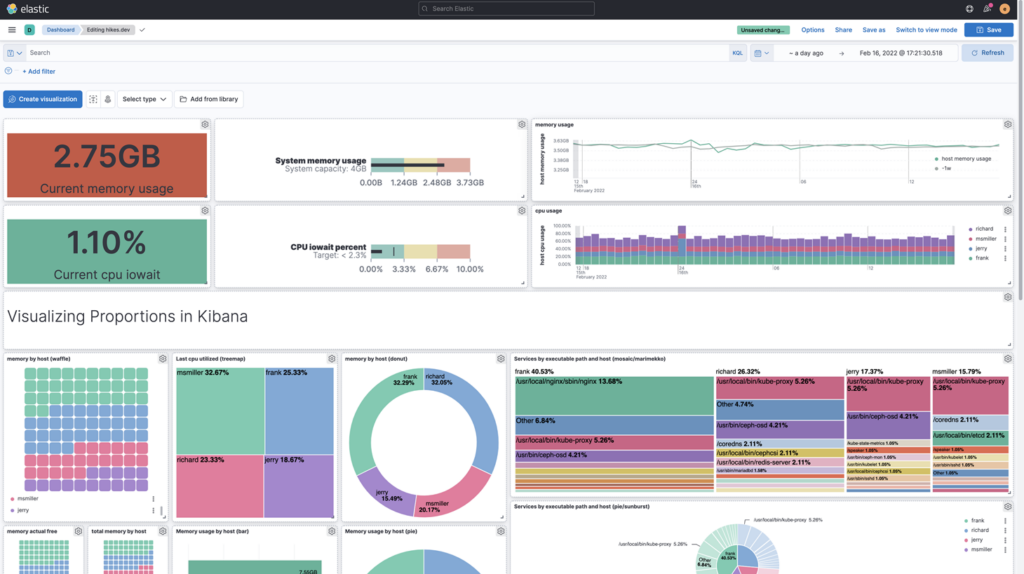
The ELK Stack – Elasticsearch, Logstash, and Kibana – is an open-source pipeline for log aggregation and analysis. It collects logs via Logstash, indexes them in Elasticsearch, and visualizes them in Kibana.
ELK is excellent when you need total control over your logging pipeline. You can transform, enrich, and query your logs as needed. It’s powerful, flexible, and battle-tested, but it’s also heavy and complex.
What it does well:
- Deep log search and filtering across large datasets.
- Flexible ingestion and transformation with Logstash.
- Strong dashboarding and visualization in Kibana.
Things to keep in mind:
- High resource usage, especially at scale.
- Complex to manage and tune.
- Requires maintenance of several moving parts.
If your observability needs revolve around logs, compliance, audits, security, or detailed debugging, ELK is as good as it gets.
9. Netdata
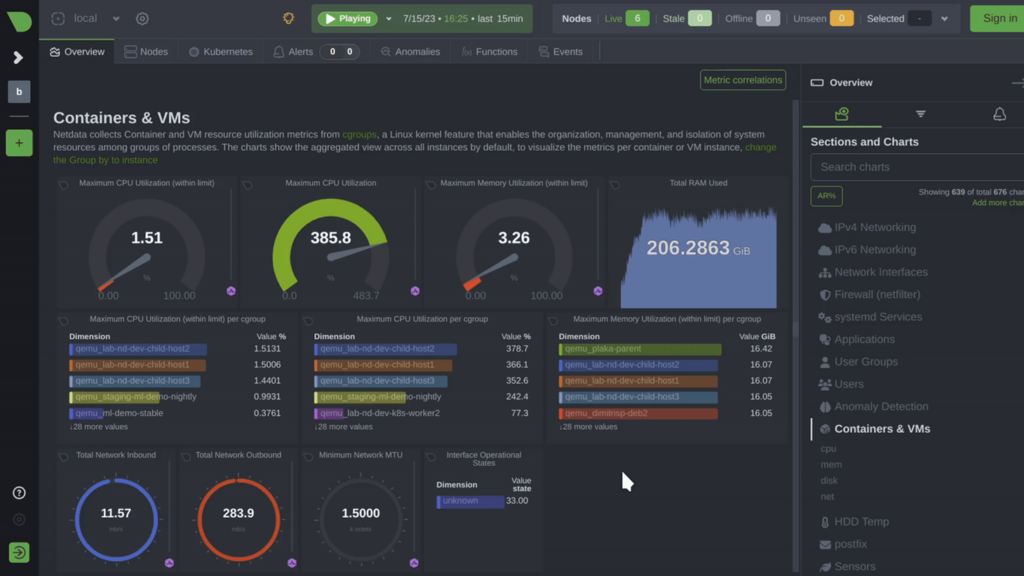
Netdata is a lightweight, open-source monitoring tool built for real-time performance insights. It collects metrics per second and displays them instantly through interactive web dashboards, with almost no setup required.
Netdata is best used when you need immediate feedback on what’s happening in a system, especially on a single node. It visualizes everything from CPU and memory usage to disk I/O and application health, all in a compact and fast interface.
It’s not meant to be a complete observability platform. It doesn’t support advanced querying or long-term historical data analysis without additional configuration. But as a quick and powerful way to see what’s going on right now, it’s hard to beat.
What it does well:
- Real-time, per-second metrics with interactive dashboards.
- Installs in minutes and starts collecting data immediately.
- Lightweight footprint, low system overhead.
- Can be self-hosted easily, including on VPS or bare-metal servers.
Things to keep in mind:
- Not ideal for long-term storage.
- Lacks the advanced integrations and features of larger observability platforms.
- Works best as a local monitoring tool rather than a central system.
If you want to monitor a server or container with minimal effort and maximum clarity, Netdata delivers a quick and easy monitoring solution.
10. Honeycomb
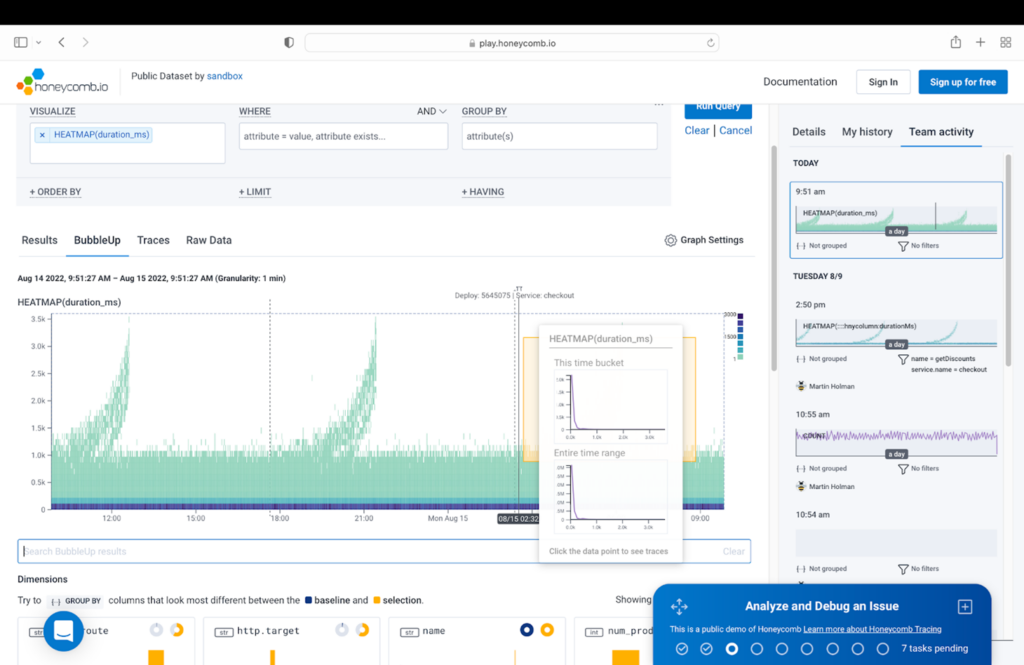
Honeycomb is a tracing and debugging tool designed for high-cardinality, event-level data. It’s built to answer the kinds of questions that traditional metrics and logs can’t: Why did this specific request fail? What’s different about this user’s experience?
Honeycomb doesn’t work with unstructured logs or simple metrics. To get valuable insights, you need to emit enriched traces from your application, complete with meaningful context, such as user ID, feature flag, or region. Once that data is flowing, Honeycomb excels at making sense of complex systems.
What it does well:
- Designed for exploring high-dimensional, high-cardinality data.
- Excellent querying UI for debugging unknown unknowns.
- Native OpenTelemetry support.
Things to keep in mind:
- Not plug-and-play, you need to instrument your code carefully.
- A tracing-only tool; doesn’t replace logs or metrics.
- Requires a shift in mindset to maximize its benefits.
If you’ve outgrown dashboards and need to trace unpredictable failures across services, Honeycomb is one of the sharpest tools you can use.
11. Jaeger

Jaeger is a self-hosted, open-source distributed tracing system. It tracks how requests move across services, which helps pinpoint where slowdowns or errors occur.
Jaeger easily supports OpenTelemetry and integrates with most modern stacks. It provides end-to-end traces displayed in a clean, easy-to-read UI. It’s not fancy, but it’s reliable.
What it does well:
- Full control over your tracing pipeline.
- OpenTelemetry support and CNCF backing.
- Clean interface for viewing request traces.
Things to keep in mind:
- Less interactive than newer tools like Honeycomb.
- Requires integration and good instrumentation to be useful.
If you want to add distributed tracing to your stack without relying on SaaS tools, Jaeger is a solid option.
12. Zabbix

Zabbix is a self-hosted monitoring system designed for infrastructure, including physical servers, network devices, virtual machines, and legacy systems. It’s open-source, mature, and powerful, but also comes with a steep setup curve.
Zabbix collects metrics using agents, SNMP, and scripts. It also offers rich support for alerting and custom checks. It works well in static environments where complete control is essential, such as on-premises systems or hybrid cloud setups with long-lived hosts.
That said, it isn’t built for cloud-native or containerized systems. You can adapt it with effort, but modern alternatives handle that use case better.
What it does well:
- Strong infrastructure monitoring with detailed alert logic.
- Fully self-hosted and free, no vendor lock-in.
- Built-in escalation, dependency handling, and scripting.
Things to keep in mind:
- Setup is manual and time-consuming.
- UI is functional, but outdated.
- Poor fit for dynamic cloud, containerized, or Kubernetes environments.
If you’re running long-lived infrastructure and want complete control over monitoring and alerting, Zabbix is a reliable, battle-tested choice.
How to select observability tools?
Before comparing tools, ask yourself one key question: What do you need to track? You may be trying to track server health, debug slow requests, or investigate logs after an issue occurs. Your specific needs should drive your decision, not feature checklists.
Here’s what to keep in mind:
- What are you monitoring?
Are you focused on system metrics, logs, traces, or all of the above?
- Does it fit your stack?
Look for tools that integrate well with what you already have.
- Will it scale with you?
A tool might be perfect now, but it starts struggling when your application or traffic grows.
- Is it easy to work with?
You shouldn’t have to fight the UI to get answers. Look for a tool that’s intuitive and easy for you.
- How is it hosted?
Self-hosting gives you control and saves long-term costs, but takes time to maintain. Managed platforms are easier to run but come at a premium.
- How does it charge you?
Usage-based pricing can increase rapidly if it’s not monitored. Open-source tools are free to use, but they require more effort upfront, and you still pay for hosting costs.
Pick the tool that helps you get answers fast, works with your setup, and won’t turn into a headache down the line, whether that’s due to price, complexity, or lock-in.
Conclusion
There’s no one-size-fits-all observability tool. What works for someone else’s stack might be overkill or not nearly enough for yours. The key is finding something that provides answers quickly.
That might mean going all-in on a managed platform or building your stack with open-source tools. Start by figuring out what you need to see, and the right tool or combination of tools becomes much easier to spot.
Best observability tools FAQ
What is the best observability tool?
For full-stack visibility, Datadog or New Relic may be a good fit. For more control and lower cost, Grafana combined with Prometheus and Loki is a strong option. Start by defining your goals and then selecting a tool that helps you achieve them.
What’s the difference between monitoring and observability?
Monitoring typically refers to the act of tracking system performance and behavior. Observability, meanwhile, has come to describe both the tooling and the broader approach to understanding complex systems using logs, metrics, and traces.
Are observability tools free to use?
Open-source tools like Grafana, Prometheus, Loki, and Zabbix are freely available and can be self-hosted. Others, like Datadog and New Relic, are commercial platforms that charge based on usage. Free tiers are available for many tools, but the cost typically depends on the amount of data.

Alanas is a Content Writer with a foundation in IT and Operations. His expertise spans cloud engineering, DevOps, and process definition and optimization, gained through his experience in fintech and data-driven organizations of various sizes. Outside of work, he enjoys traveling, exploring history, gaming, and spending quality time with his family. Find him on LinkedIn.