n8n benchmark: Real-world resource usage tested
Mar 10, 2026
/
Aris S.
/
10 min Read

If you are self-hosting n8n, you probably asked the same question I did: How many server resources do my n8n workflows actually consume?
After all, ensuring enough resources is crucial to maintain optimal performance, but you don’t want to overspend on server resources that will be unused.
Sources online give different numbers of CPU cores and RAM, like a single-core processor and 2 GB of RAM. But that raises practical questions:
- Do I actually need that many resources for a simple workflow?
- If I deploy two workflows, do I need a server twice as powerful?
- How predictable is n8n’s resource usage in real-world scenarios?
To answer these questions, I ran a series of real-world tests to measure the actual CPU, RAM, and network usage of n8n workflows under different conditions.
TL;DR: Key takeaways
Before we go into the nitty-gritty details, here are the key takeaways from my test:
- Resource consumption is node-dependent. Nodes that interact with external sources, like the HTTP request node, consume more network I/O resources than nodes that execute tasks locally. However, RAM is the dominant resource across almost all nodes, internal or external.
- Scaling is somewhat linear. Running multiple identical workflows often results in roughly linear scaling. Once you introduce node variety, resource usage becomes far less predictable.
- Delays don’t reduce the usage peak. Adding an interval between node executions doesn’t affect the usage spike. However, it allows you to space out resource allocation over time to make room for other workflows.
- Running workflows in parallel vs sequentially. There’s no definitive difference in the peak hardware usage between running workflows in parallel and sequentially.
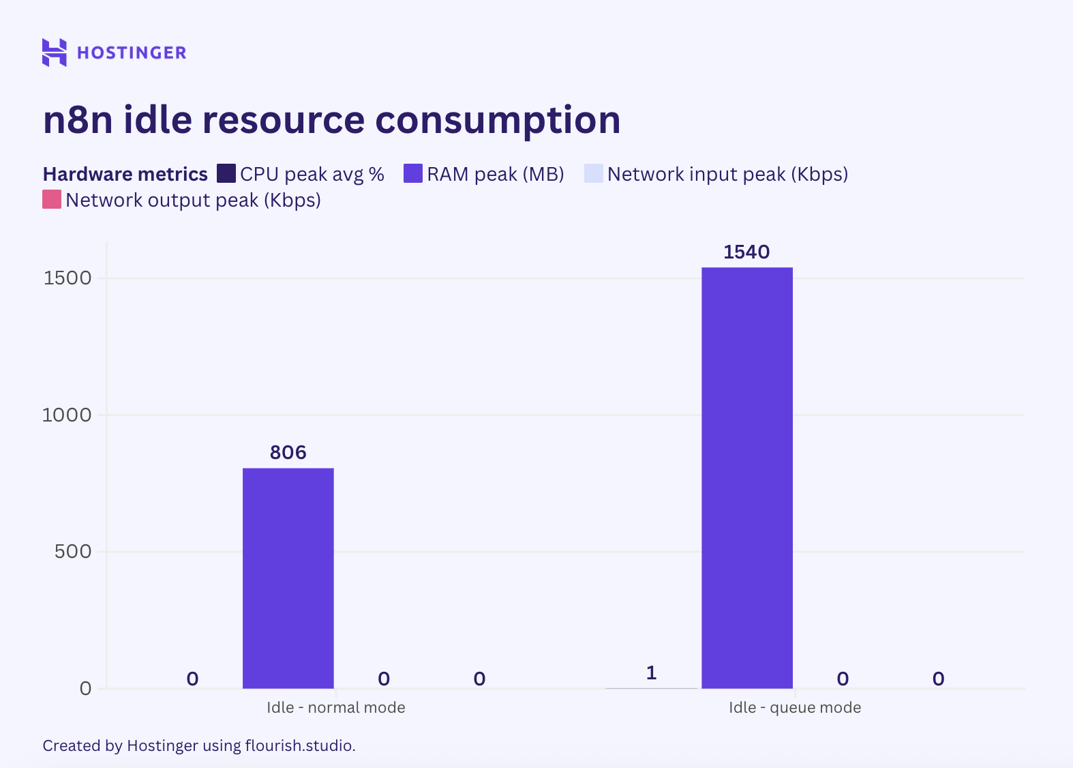
- The n8n queue mode isn’t a secret sauce. Enabling n8n queue mode roughly doubles baseline RAM usage, even when idle. It doesn’t reduce peak usage for small setups and only makes sense at a larger scale.
The n8n benchmark methodology
This benchmark will focus on the peak CPU, RAM, and Network I/O utilization of the host server.
It’s worth noting that there are other n8n benchmarks. For example, the n8n Scalability Benchmark blog post examines how the platform handles a large amount of requests, focusing on metrics such as failure rate and response time.
However, instead of a controlled, synthetic benchmark, I focused on real-world peak resource utilization under practical automation scenarios.
Expert tip
If you’re unsure which Hostinger VPS plan best fits your requirements, start with KVM 2 – it provides a solid baseline and can be upgraded instantly with a single click as your needs grow.

Let’s explore the methodology in more detail, starting with understanding the test environment.
Test environment and tools for n8n benchmark
Here is the setup that I used to run the n8n benchmark tests:
- Server. Hostinger KVM 2 VPS hosting plan.
- Operating system. Linux Ubuntu 24.04 LTS.
- Tool. btop for monitoring, Docker for running n8n in a container.
I chose Hostinger KVM 2 because it offers ample resources without being overly expensive. With two vCPU cores, 8 GB of RAM, and 100 GB of NVMe SSD storage, it provides ample headroom should the tests demand it.
As for the operating system, I chose Ubuntu 24.04 LTS simply because it is stable, easy to use, and popular. If you use a more minimal distro, there might be slight performance differences, but it shouldn’t be game-changing.
I deployed n8n on Docker. It’s the recommended self-hosting approach, and with Hostinger’s VPS template, installing n8n in a container takes only a few clicks. I also set up n8n queue mode using Hostinger’s template and its default pre-configured settings.
Considering Docker overhead? 🐳
Docker runs close to native performance since it shares the host kernel. In practice, the overhead is negligible compared to running n8n directly on the host.
For monitoring, I used btop because it’s simple and sufficient for gathering data for this benchmark. It also provides a graph that simplifies the monitoring process.
n8n benchmark test scenarios and tracked metrics
To run the benchmark, I ran each of the following tests at a 2-second interval for several minutes to ensure consistent data. For some scenarios, I increased the interval to avoid API rate limits.
For every test, I tracked peak values for:
- CPU utilization
- RAM consumption
- Network I/O
Test 1: Node-level benchmark
This test isolated individual nodes to answer:
- How much CPU, RAM, and network bandwidth does a node consume?
- Do nodes that interact with external services require more resources than those that run independently within n8n?
- Does the resource consumption increase linearly with the number of nodes?
Important! For simplicity, I’ll refer to nodes that require interaction with external services as external nodes and those that run independently within n8n as internal nodes.
Test 2: Single-workflow benchmark
This test focuses on complete workflows:
- Simple workflow with two internal nodes
- Complex workflow with seven internal nodes
- Complex workflow with a total of seven nodes, a combination of internal and external
- Effect of adding execution delays
Test 3: Multiple workflows in one instance
This test examined:
- Do the CPU, RAM, and traffic consumption scale linearly with the number of identical workflows?
- Is the resource consumption predictable based on the number and type of running workflows?
- Is alternating execution between multiple workflows a viable strategy for minimizing resource spikes?
Test 4: Queue mode benchmark
I wanted to verify the impact of n8n queue mode on the resource consumption of a workflow:
- Does n8n queue mode help minimize CPU, RAM, and network utilization? If so, by how much?
- What are the drawbacks of using the n8n queue mode, if any?
- Is n8n queue mode a viable option for running workflows on a low-end system?
Between tests, I waited until resource usage returned close to baseline to avoid skewed results.
Important! During my testing, there were instances where the idle RAM usage greatly deviated from the initial baseline. In this case, I normalized the value to make sure the result is consistent. I subtracted the new baseline from the initial one, and then added the difference to the RAM benchmark result. For example, if the initial baseline is 800 MB and the new one is 824 MB, the difference is -24. This means a RAM usage of 900 MB will be normalized to 876 MB.
Limitations and caveats for the benchmark
This benchmark aims to reflect the real-world usage of n8n workflows, but several factors influence results:
- Node variation. There are hundreds of n8n nodes with different behaviors, which may consume resources differently than the ones I tested.
- Hosting environment. The hosting environment and setup that I use for deploying n8n is relatively minimal. You may experience more or less performance overhead depending on the server type, operating system, or deployment method you use.
- Workflow logic. The workflows in this benchmark are simple and don’t involve complex logic. If your workflows process large amounts of data or files, expect higher resource utilization.
- Scale of deployment. I use workflows containing fewer than 10 nodes to run the test. Using more nodes increases resource consumption.
With that in mind, let’s get our expectations straight: this test is not a one-size-fits-all solution that determines the exact minimum hardware requirement for your n8n workflow.
Your mileage will vary depending on your actual usage and setup. Instead of using the test result as the standard, think of it as a guide for understanding the real-world n8n behavior, which will help you better plan your hosting environment and scaling strategy.
n8n benchmark results
Here’s the result of my n8n benchmark with different test scenarios.
n8n benchmark on a node level
Before running any node, I checked the server’s resource consumption at idle to establish a baseline.
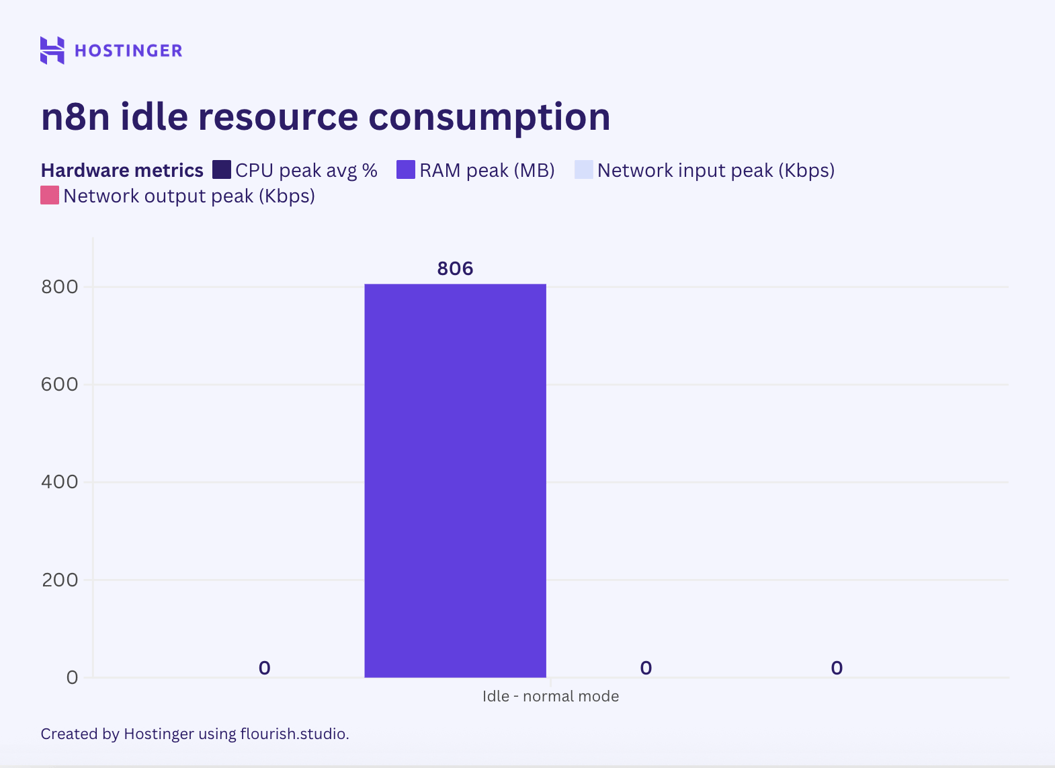
Without any active node or workflow, n8n consumed 0% of CPU and 860 MB of RAM. The network I/O only reached a few bytes or a single-digit kilobyte, so I normalized it to zero because it’s insignificant.
Then, I ran the test with these workflows:
- A workflow with a single Code internal node that generated 1,00 random decimal numbers using JavaScript.
- A workflow with two identical Code internal nodes, both generating random 100 decimal numbers.
- A workflow with a single Google Sheet Get Row node that fetched data from a column of a sheet.
- A workflow with two Google Sheet nodes, one for pulling data and another for writing the data.
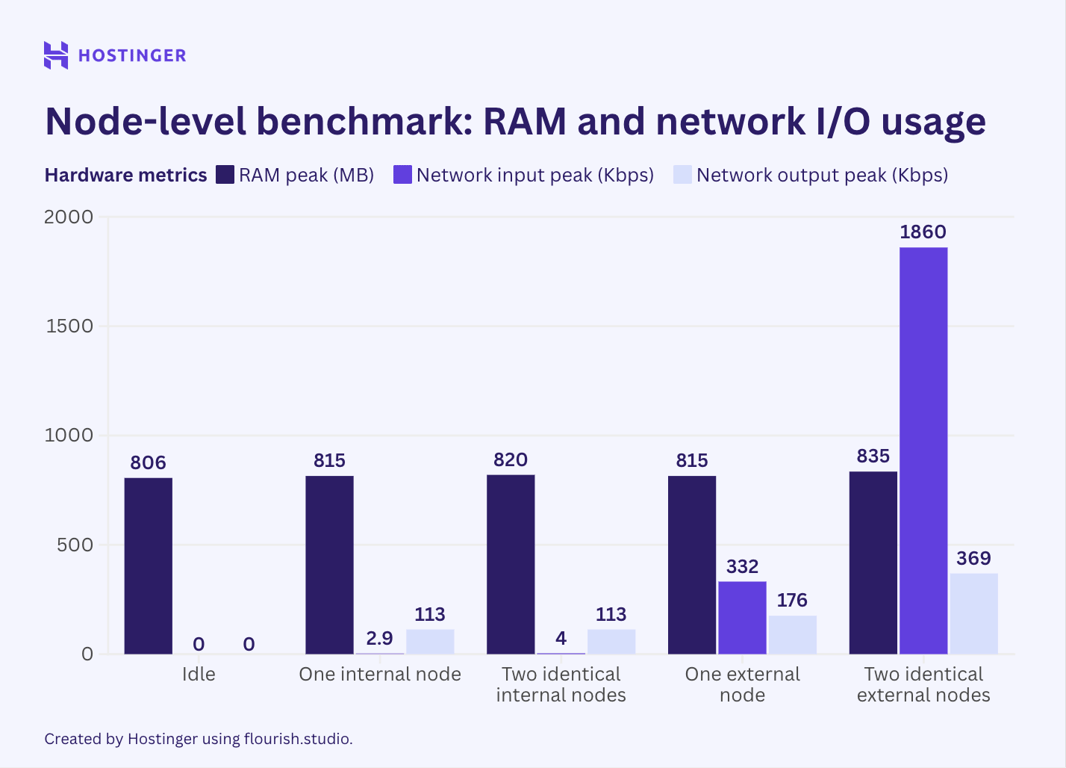
The resource consumption for all the tests, compared to the idle state, is as follows:
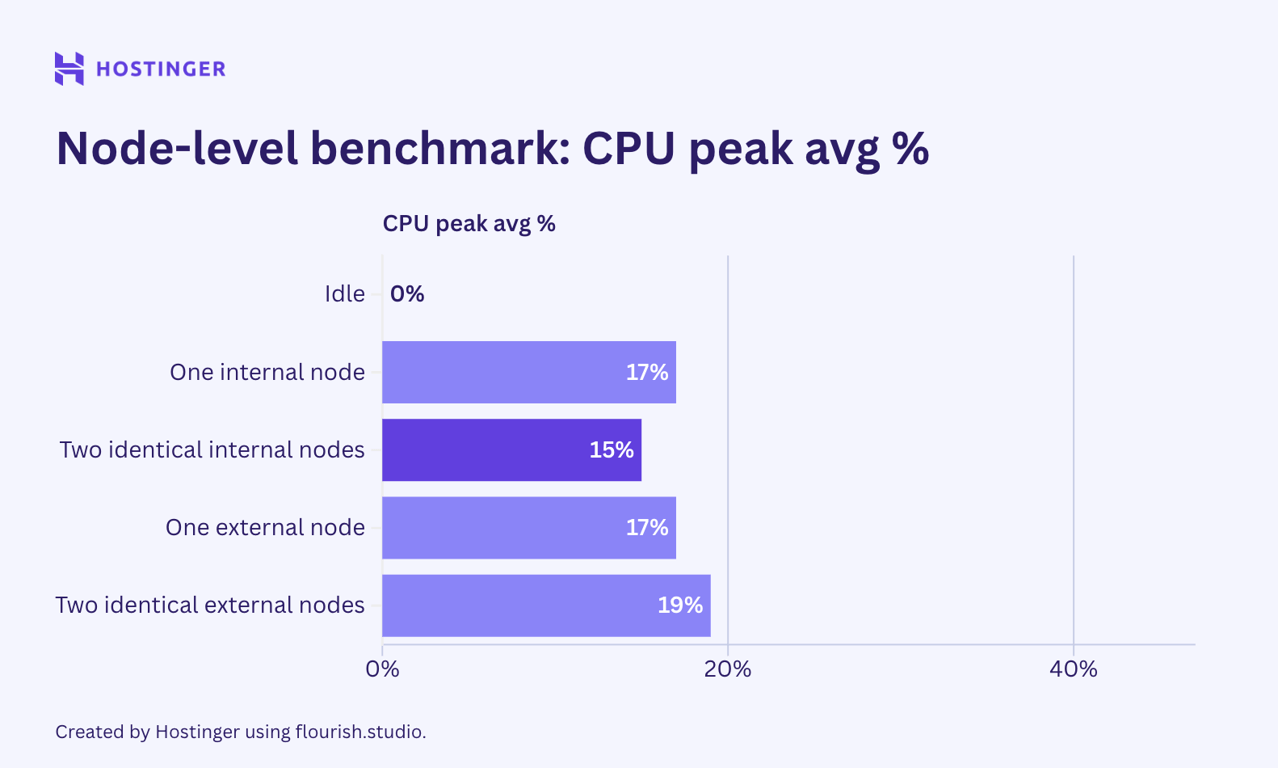
The results are as expected: resource consumption increased when I added more nodes. That said, the scaling behavior was neither linear nor predictable.
For example, an internal node increased the RAM usage by 9 MB from the idle state. When I inserted the same node, however, the memory utilization increased by 5 MB. This behavior was also present with the external nodes.
When it came to external nodes, they indeed placed a greater network I/O load, even up to 10 times that of the internal ones. Network usage also increased significantly when I added the second external node, unlike CPU and RAM.
n8n benchmark for a single workflow
After understanding the node behavior in isolation, I wanted to check how an actual workflow performs. Here’s a list of workflows I used:
- Simple workflow with two unique internal nodes to generate 100 random integers and calculate the average.
- Complex workflow with seven unique internal nodes to generate random data and run various operations like normalization.
- Simple workflow with two unique external nodes fetching data from a Google sheet and writing it to another document.
- Complex workflow with seven unique internal and external nodes, with the task of fetching VPS data via API, filtering it based on rules, and logging it on a Google Sheet when the criteria were met.
Here are the results for all the test scenarios above:
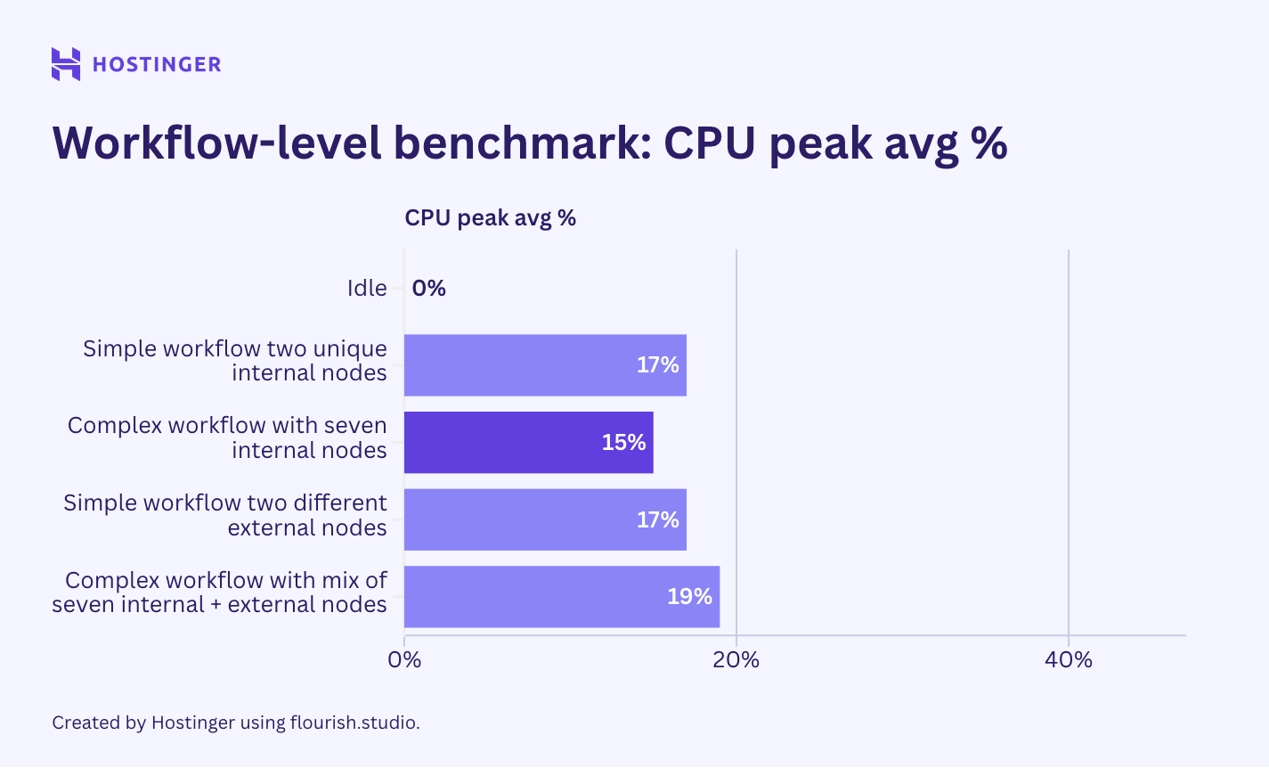
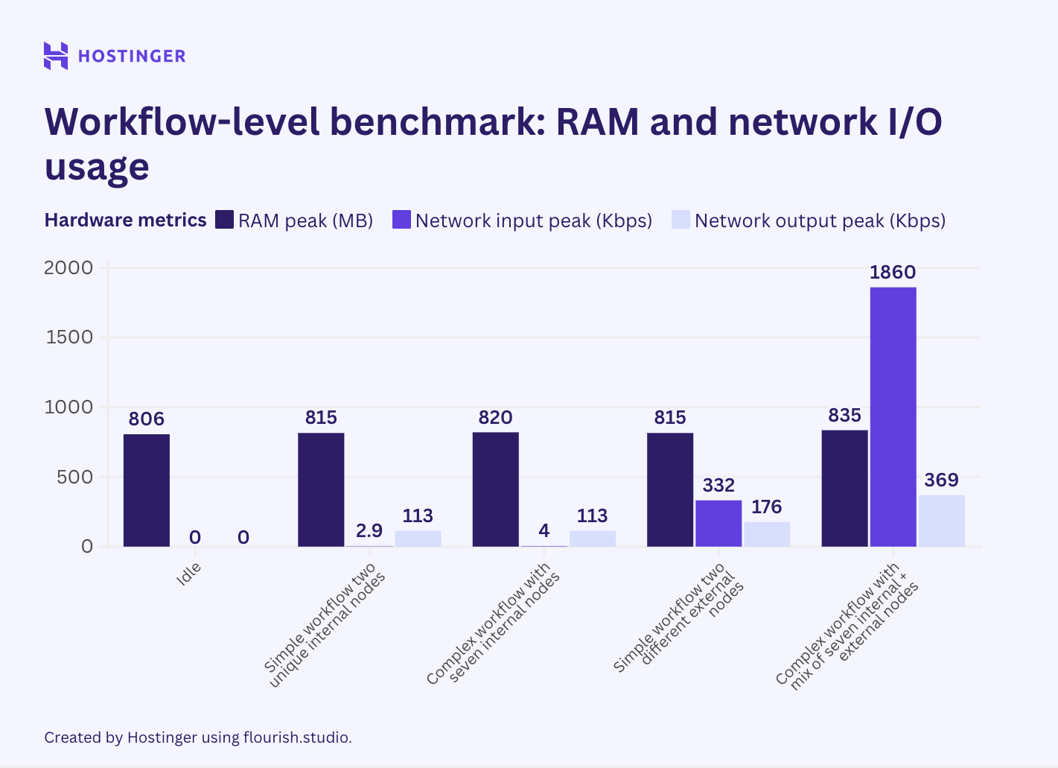
The results show that adding a new, unique node will increase resource consumption more than inserting an identical node. This is prevalent in both simple and complex workflows, suggesting that a workflow’s resource utilization depends on the variety of its nodes.
The resource consumption behavior in this second test also appears consistent with our node-level test: external nodes significantly affect network I/O utilization, whereas internal ones do not.
Next, I added a 2-second delay using the Wait node in the complex workflows to see if halting execution reduces resource consumption.
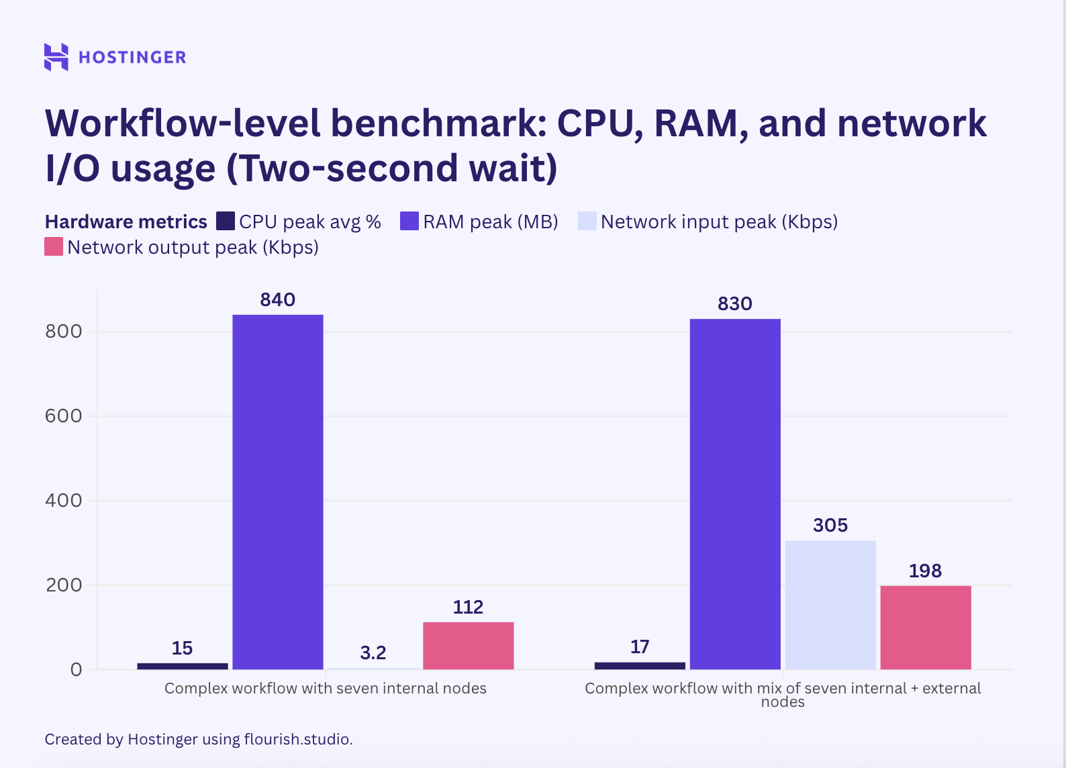
The peak usage decreased slightly, but it’s safe to say that the difference is insignificant. That said, the interval helps free resources at a specific time, as shown in this graph.
n8n benchmark for multiple workflows
In this test, I ran multiple instances of the same four workflows used in the previous section. Here’s the scenario:
- Running two instances of the same workflow in parallel. I added one more instance if the resources and the API rate limit allowed it.
- Alternating the execution of identical workflows through the sub-nodes’ execution. In other words, after the first workflow completes, the second instance runs.
- Running different workflows in parallel. I ran a simple internal workflow alongside a complex one.
Let’s begin by checking the test results of the first scenario, focusing on the simple workflows with two nodes:
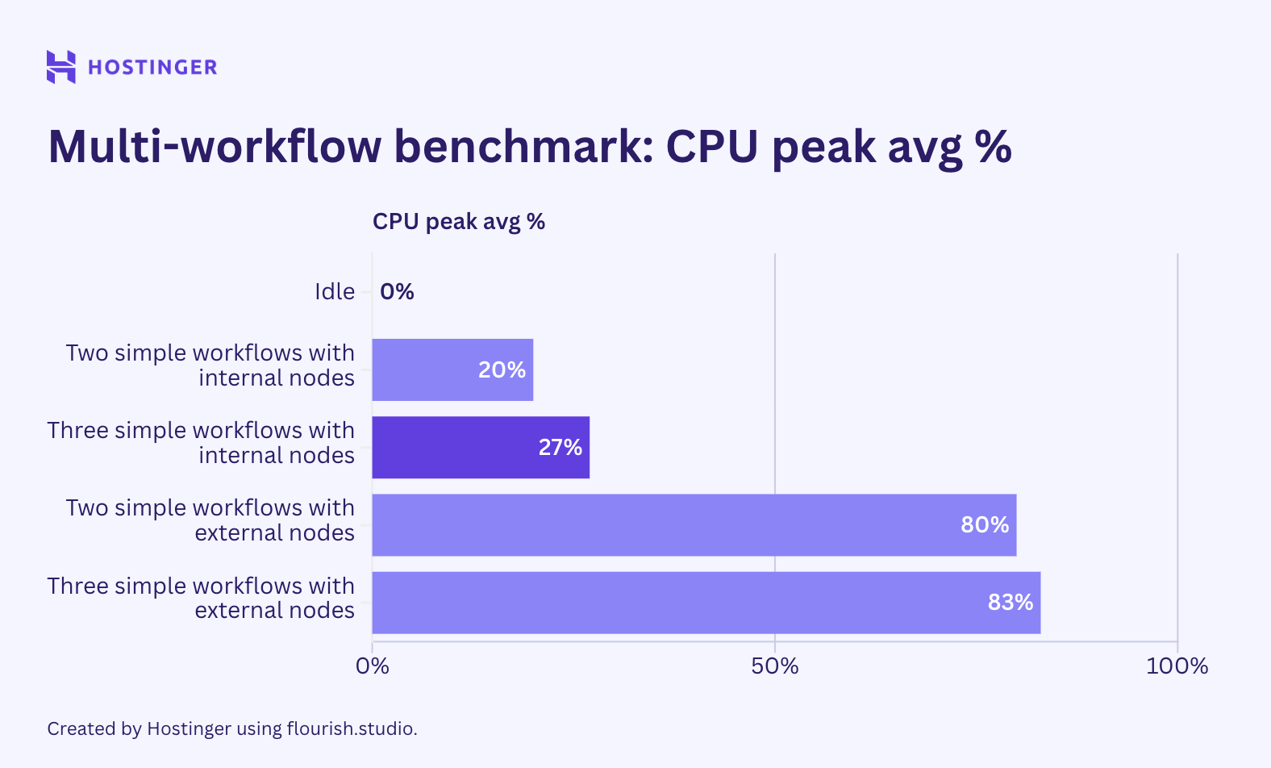
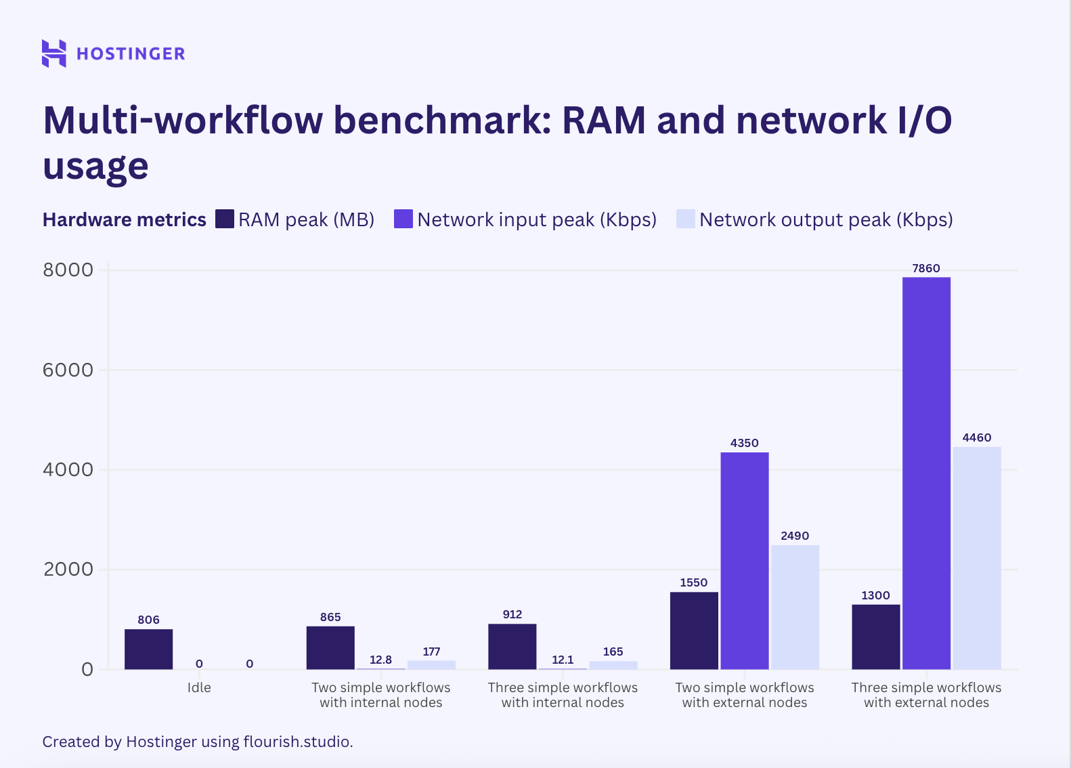
An interesting case happened. For simple workflows with internal nodes, the resource usage was somewhat predictable:
- One execution peaks at 17% of CPU load and 815 MB of RAM.
- Two executions peak at 20% of CPU load and 865 MB of RAM.
- Three executions peak at 27% of CPU load and 912 MB of RAM.
Based on the breakdown, an additional execution of the workflow added approximately 40-50 MB of RAM usage, and CPU usage increased somewhat linearly.
Meanwhile, the simple workflows with external nodes exhibited unpredictable usage and scaling behavior. The resource utilization difference when running one, two, and three instances is random, despite showing an upward trend.
Now, let’s see how the complex workflows with seven nodes performed:
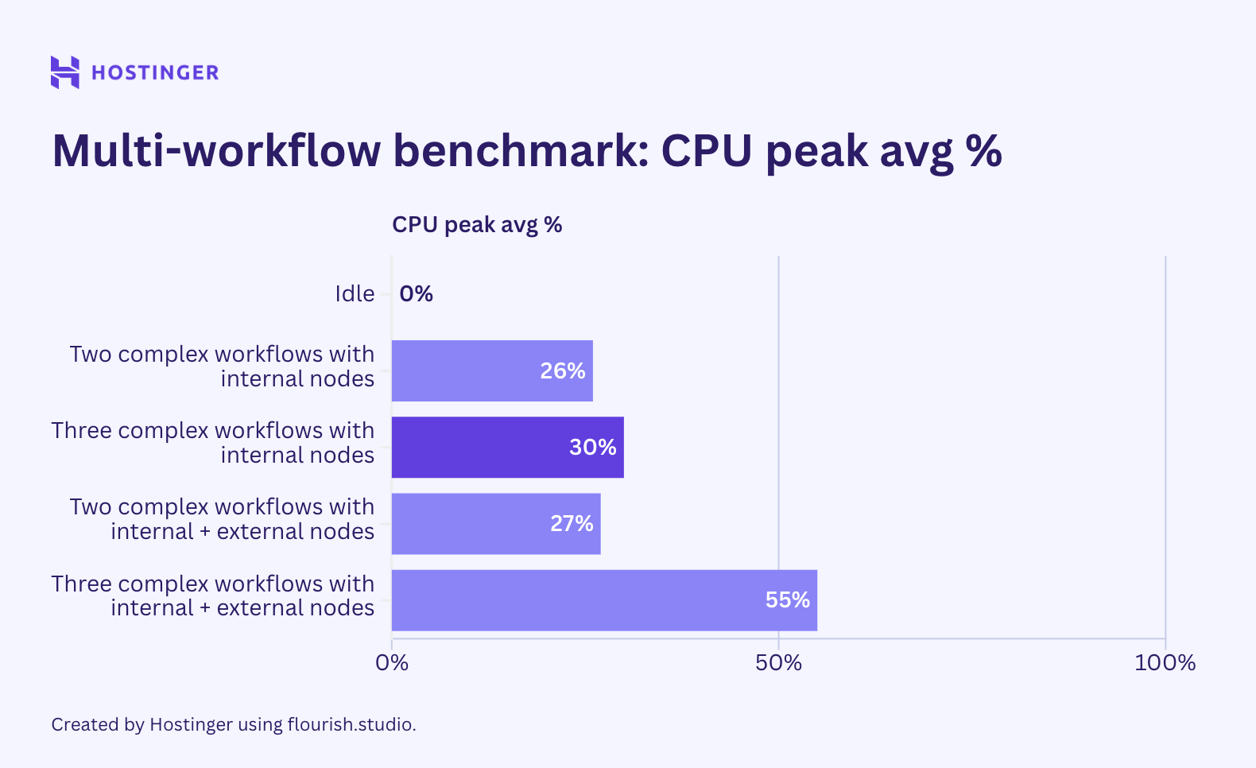
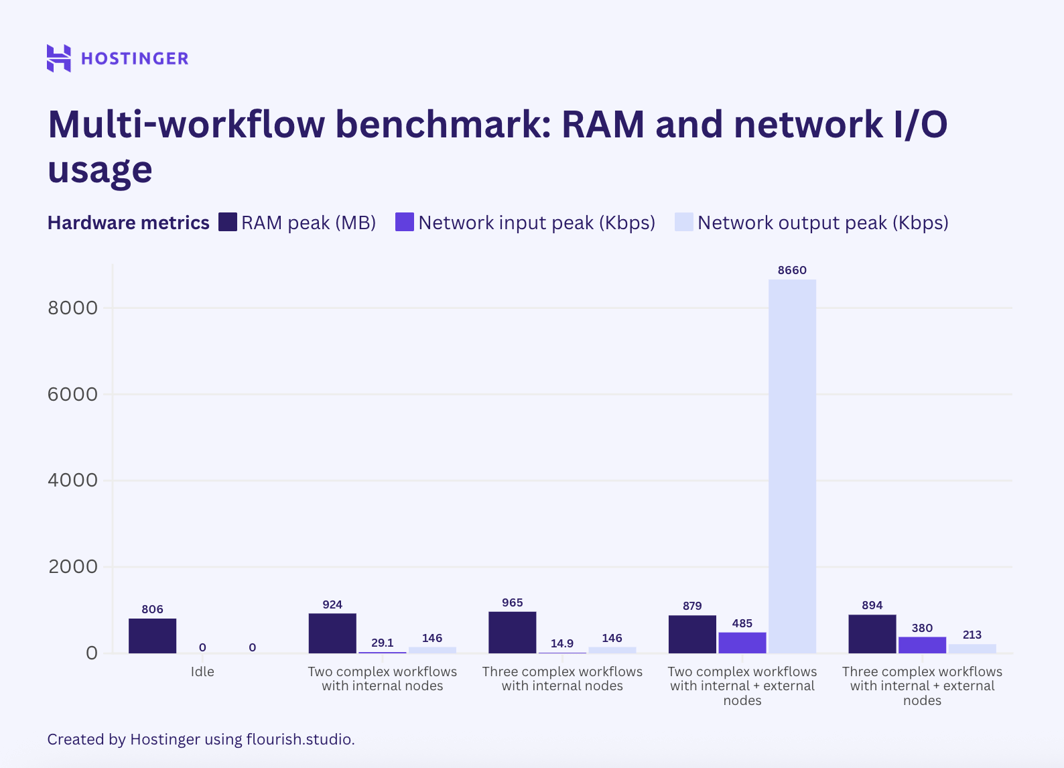
The simple workflow behavior was consistent. The usage for workflows with internal nodes was relatively linear and predictable. Meanwhile, workflows with a mix of internal and external nodes had fluctuating utilization, even in the network I/O.
For the second scenario, I chained two identical workflows using the sub-workflow execution node. This allowed me to execute them in an alternate order. The result is as follows:
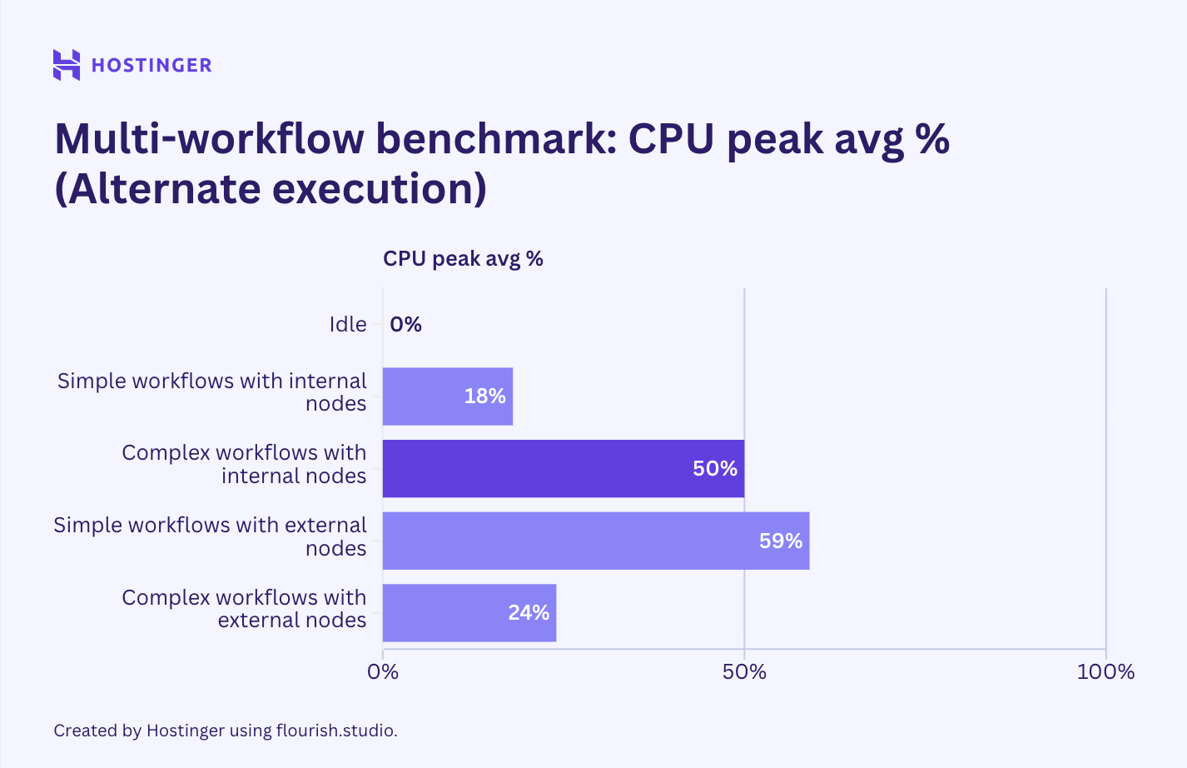
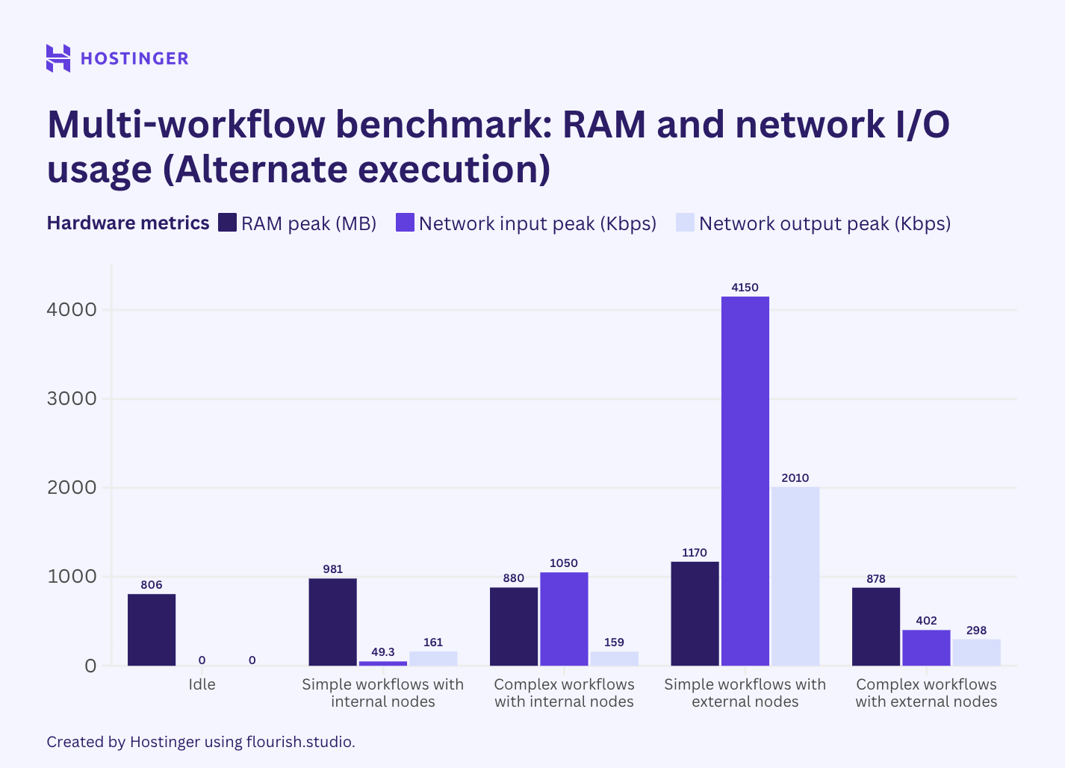
As we can see, utilization remained relatively unchanged. However, CPU utilization for complex internal workflows nearly doubled when executed in a linear order compared to when executed in parallel.
Similarly, the network output of the external workflows, when run in a linear order, showed a significant drop compared to when they are executed in parallel.
What does the result tell us? 💬
Apart from the two mentioned cases, the hardware utilization of workflows run in parallel and linear order isn’t that far off. The lower network output of the alternate execution might be due to the workflow hitting the API rate limit, which means there’s no data to exchange. The lower network input, though not as significant, also indicates a rate limit issue. I can’t find a plausible explanation for why the alternate execution results in a CPU usage jump of almost 100%. Given that all other tests show that the CPU utilization remains the same or slightly lower when the workflows are run in a linear order, this might be an anomaly.
Next, I tested the third scenario by running a simple internal workflow in parallel with a complex internal workflow.
As previously discussed, a simple internal workflow consumed approximately 50 MB of RAM and 7% of CPU utilization. In comparison, a complex internal workflow increased CPU usage by about 4% and required an additional 40 MB of RAM.
If n8n usage is linear, running these workflows in parallel would increase CPU usage by approximately 11% and utilize an additional 90 MB of RAM. However, this was not the case, as shown by my test results:
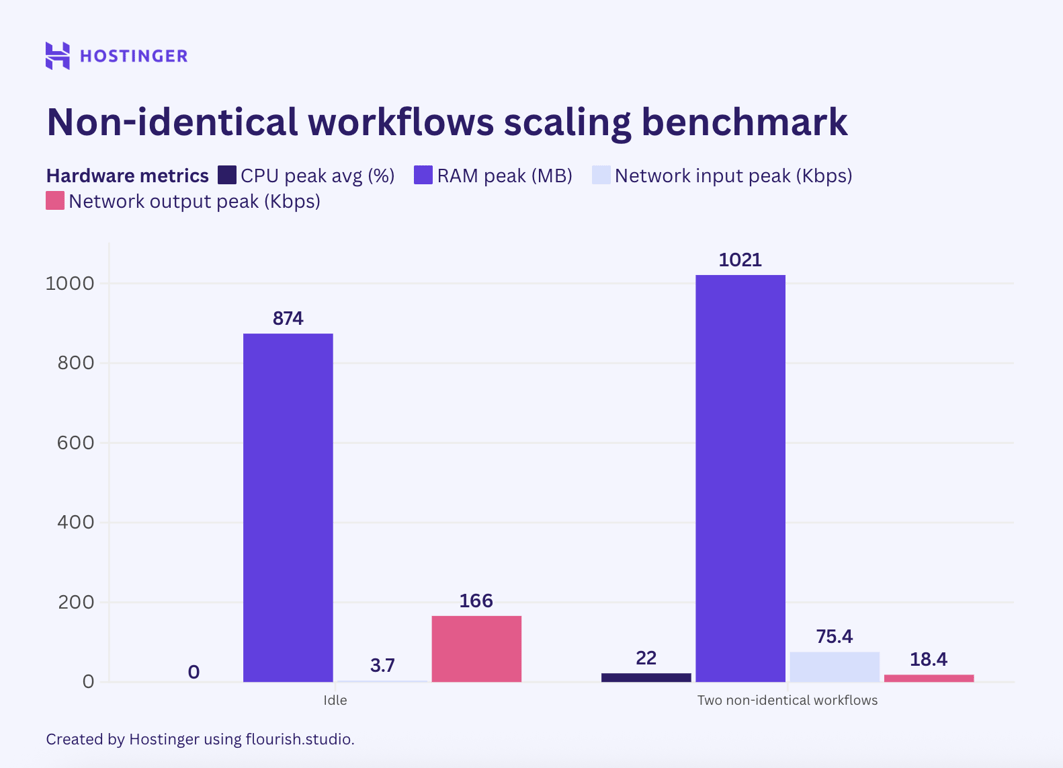
Based on this data, I doubt we can predict the peak resource utilization of multiple different workflows. For identical workflows, it’s still possible to predict hardware utilization, provided the node doesn’t vary significantly.
n8n benchmark with queue mode
The n8n queue mode distributes your automation tasks across multiple workers. This enables each process to run independently of the main n8n instance, helping offload tasks and improve scalability.
Theoretically, the queue mode should improve the stability of your automation when running a large number of workflows. With this in mind, I wanted to rerun the previous workflows in queue mode to see if resource utilization differs. The test scenarios are:
- Running a simple workflow with two unique internal nodes. Then, I ran a new instance of the same workflow in parallel, up to three concurrent executions.
- Executing a simple workflow with two unique external nodes, adding a new instance of the same workflow run in parallel, up to three concurrent executions.
- Deploying a complex workflow with seven internal nodes. I added a new instance of the same workflow running in parallel, up to three concurrent executions.
- Running a simple workflow with seven internal and external nodes. Similar to the previous scenarios, I added a new instance of the same workflow in parallel, up to three concurrent executions.
Surprisingly, my test showed that the baseline RAM utilization was twice the normal n8n level, while the CPU and network I/O remained the same. This might be due to n8n creating the workers.
Now, let’s examine the resource utilization of the simple workflows with two nodes running in n8n queue mode.
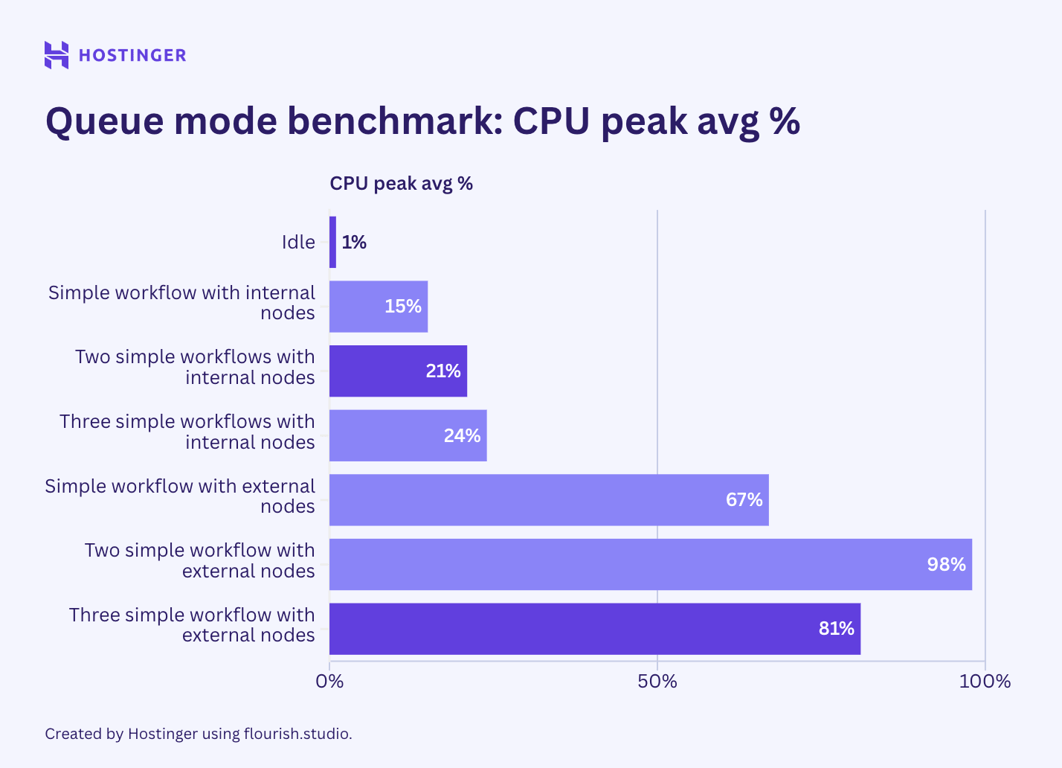
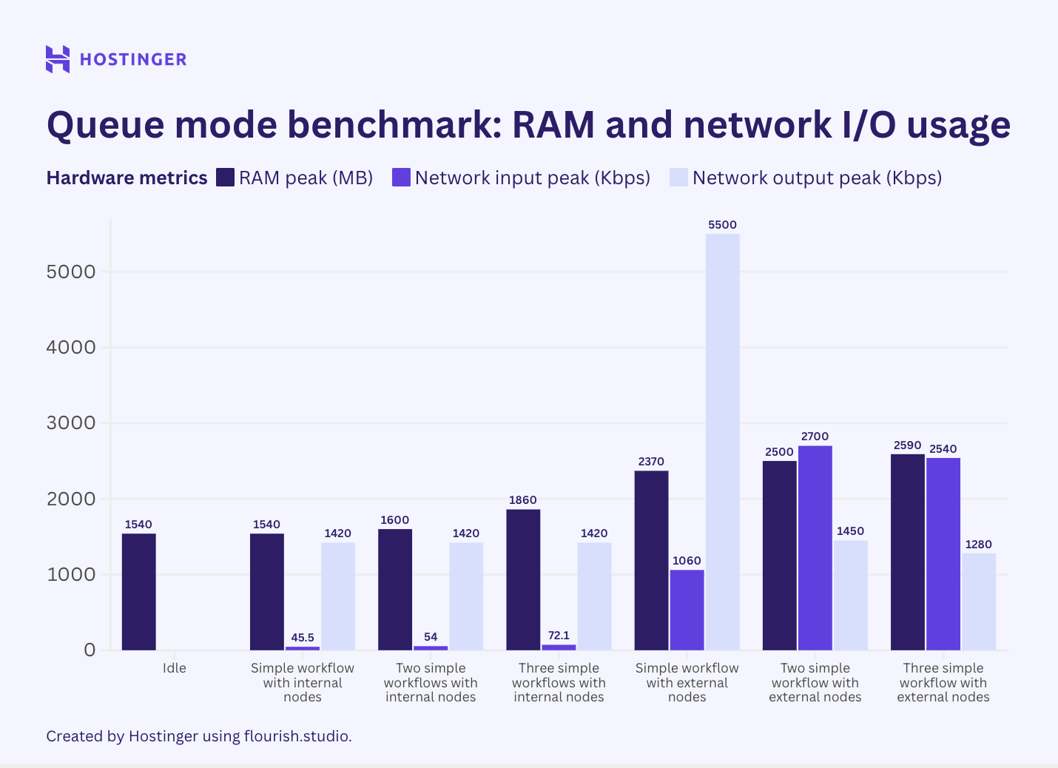
Meanwhile, this was the hardware usage of complex workflows with seven nodes in the queue mode:
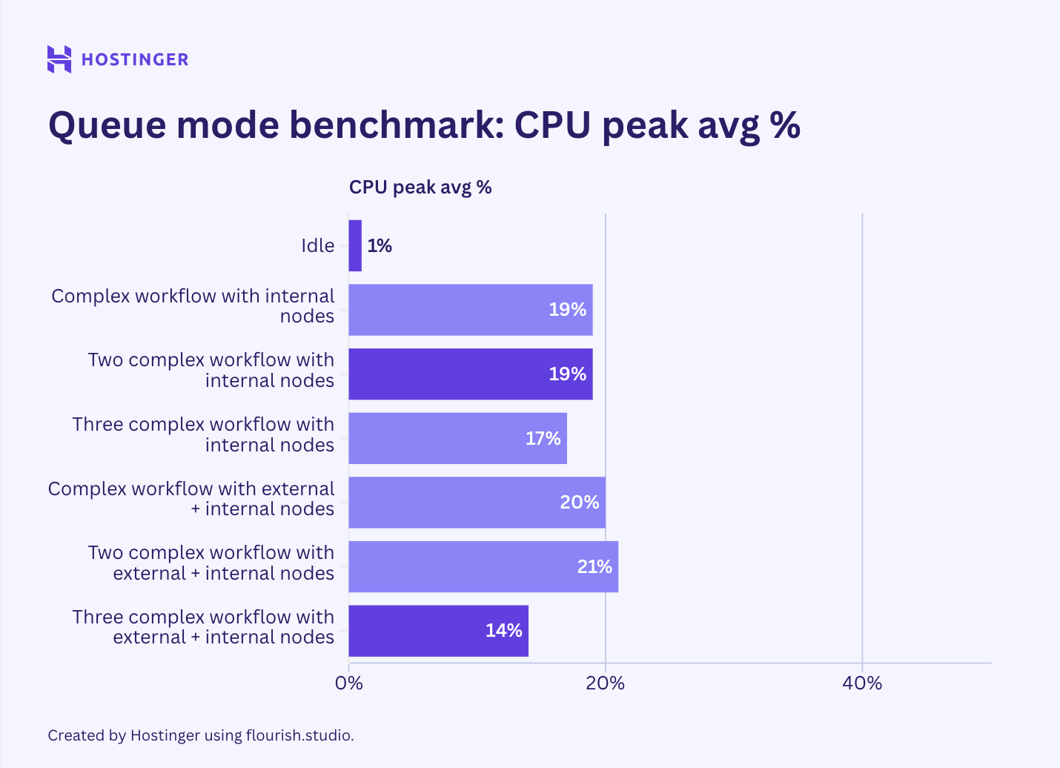
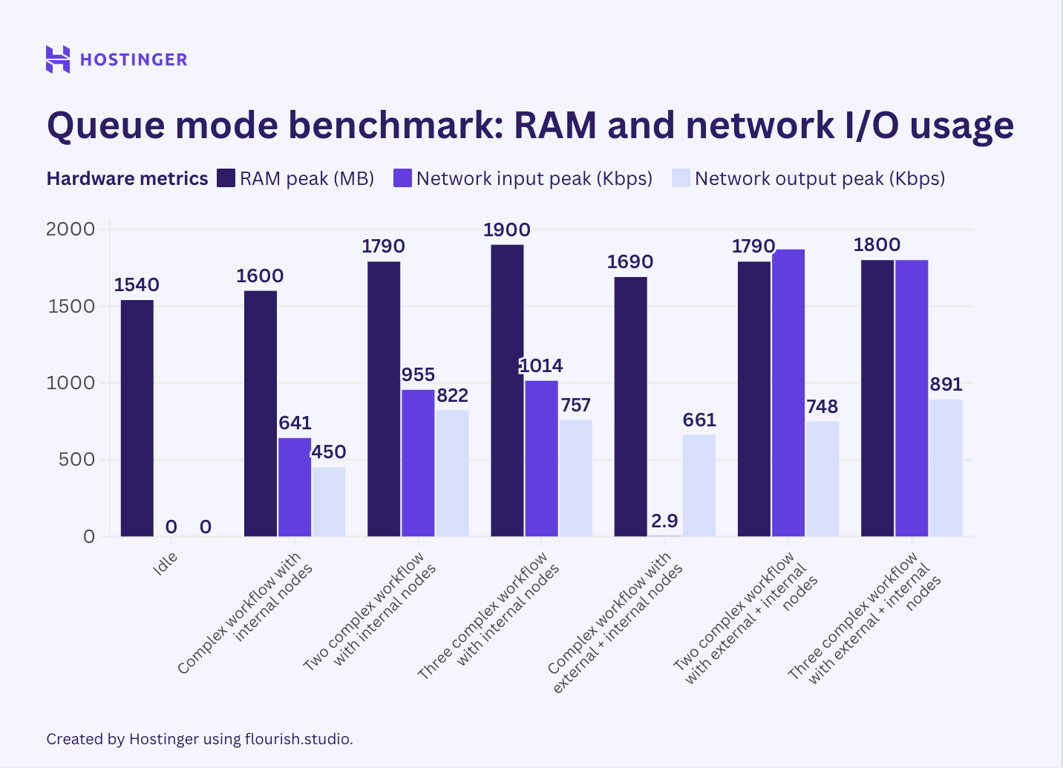
Contrary to my initial belief, the test results indicate that n8n queue mode doesn’t help lower peak resource utilization. While my observation suggests that the queue mode’s hardware usage is more stable than vanilla n8n, the average consumption is higher.
Important! Since I set up the n8n queue mode using Hostinger’s VPS template, the number of workers was set to three by default. Note that the number of workers will impact the resource consumption and your workflow execution.
When I added more workflow executions, I expected the queue mode’s effect to be more apparent, but it wasn’t. For instance, let’s compare how multiple executions of a complex workflow with seven internal nodes behave in queue and vanilla mode:
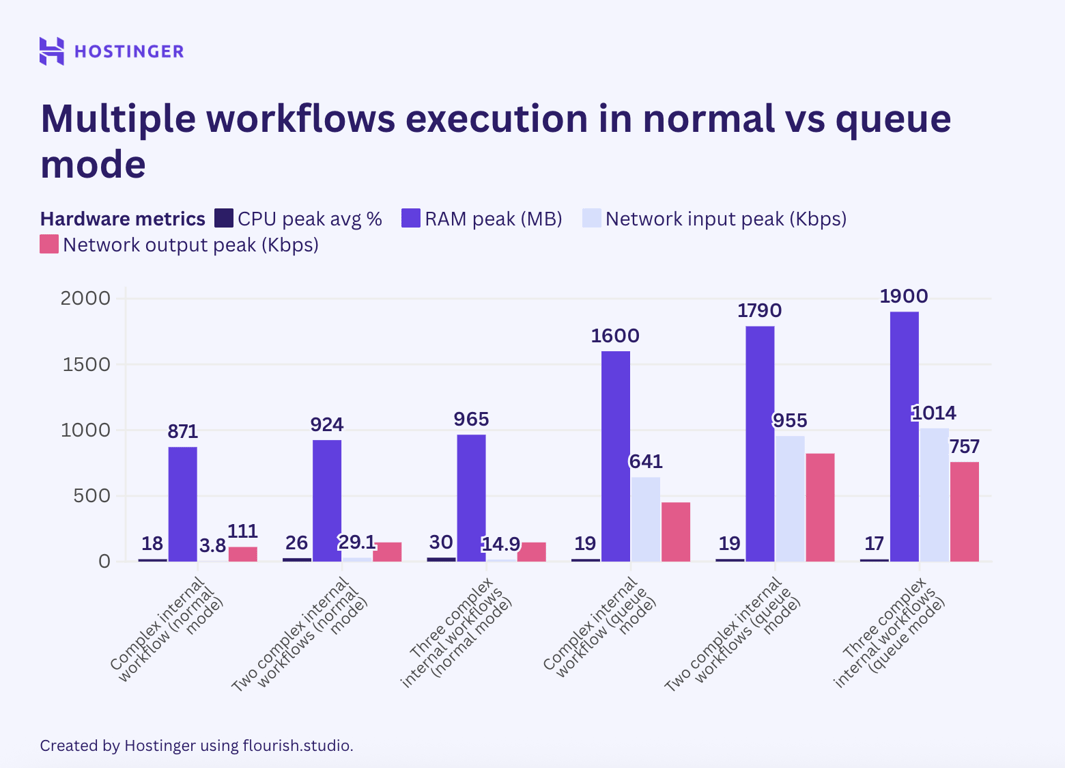
In vanilla n8n, an additional execution of such a workflow used roughly 40-50 MB of RAM, whereas in queue mode, it added at least 60 MB. When running three instances of this workflow, the RAM consumption jumped by over 100 MB.
Based on the benchmark, we understand that n8n queue mode isn’t a solution that can magically allow you to run an intensive workload on a low-end machine. In fact, this mode consumes more hardware on average than normal n8n.
If you deploy hundreds of workflows, however, the effect of the queue mode might be more apparent. It’s typically recommended when your automation setup experiences issues like lagging webhook and significant latency, where distributed workloads can help maintain concurrency.
What does the n8n benchmark tell us?
This test was designed to provide a rough estimate of how n8n workflows use resources. Since the test data sample is small, the resource utilization behavior may change at scale or when other variables are involved.
Also, I focused only on peak RAM, CPU, and network I/O utilization. If you instead consider averages and other metrics, such as workflow execution time, n8n may exhibit different behavior.
Practical recommendation
If you’re starting with 10-20 workflows, I recommend hosting them on a server with at least 4 GB of RAM. Even if you anticipate your automation will use less than 4 GB, this provides headroom and future-proofing in case you need to add more workflows.
Additionally, monitor the resource utilization closely and use an n8n hosting provider that offers easily scalable plans, like Hostinger. This way, you can add more resources if your automation setup needs more computing power than expected.


Aris is a Content Writer specializing in Linux and WordPress development. He has a passion for networking, front-end web development, and server administration. By combining his IT and writing experience, Aris creates content that helps people easily understand complex technical topics to start their online journey. Follow him on LinkedIn.


Comments
0 responses