What are core web vitals and how to measure them
Mar 10, 2026
/
Brian
/
8 min Read

Google uses Core Web Vitals to measure web page loading speed, interactivity, and visual stability. Among other factors like mobile friendliness and security, Core Web Vitals are an essential element of Google’s page experience signals.
Since page experience is part of Google’s ranking algorithm, optimizing it can help improve your website’s search visibility.
If you want to claim the top spot on Google, this guide will help you understand what exactly Core Web Vitals are, why they’re important, and how to measure Core Web Vitals metrics.
What are Core Web Vitals?
Core Web Vitals (CWV) are a set of metrics used to assess a webpage’s overall usability. These metrics are part of a larger Google initiative to deliver a better browsing experience and improve user satisfaction.
There are three Core Web Vitals:
- Largest Contentful Paint (LCP) or page load time.
- Interaction to Next Paint (INP) or responsiveness.
- Cumulative Layout Shift (CLS) or visual stability.

Each of these metrics has a certain threshold that determines whether your page experience is Good, Needs Improvement, or Poor.
To classify the overall performance of your web page, Google applies the 75th percentile value method. In other words, your page is considered good if at least 75% of page views meet the Good threshold of every Core Web Vital.
Conversely, if 25% of page views meet the Poor threshold, it indicates that your page needs to improve its performance.
Why are Core Web Vitals important for site owners?
To determine a website’s ranking, Google considers various page experience signals, including its Core Web Vitals.
The better your site’s Core Web Vitals scores are, the more likely it is to rank high on the search engine results pages (SERPs).
But more importantly, having a fast and responsive website keeps visitors around longer. This is because 40% of users abandon a web page that loads more than 3 seconds.
If you can convince prospects to stay, you will also have more opportunities to convert them into customers.
Core Web Vitals lifecycle
The Core Web Vitals metrics are not set in stone—they may change over time based on user input. For example, in March 2024, the First Input Delay (FID) metric was replaced by Interaction to Next Paint (INP).
Each Core Web Vitals metric goes through several stages before they become stable:
- Experimental. Google tests new metrics and gathers feedback from users and developers.
- Pending. Metrics that have passed the experimental stage enter the pending period for at least six months. The idea is to give the web community enough time to adapt and give more feedback.
- Stable. If the public reception is good, the metrics officially become part of Google’s Core Web Vitals.
Main metrics of Core Web Vitals
Currently, three main metrics make up Core Web Vitals:
Largest Contentful Paint (LCP)
Largest Contentful Paint measures a web page’s loading performance. It tracks how long it takes to render the page’s most prominent elements, such as images, videos, or text blocks.
What’s considered a good LCP score? According to Google, your pages should load in under 2.5 seconds to provide a positive user experience.
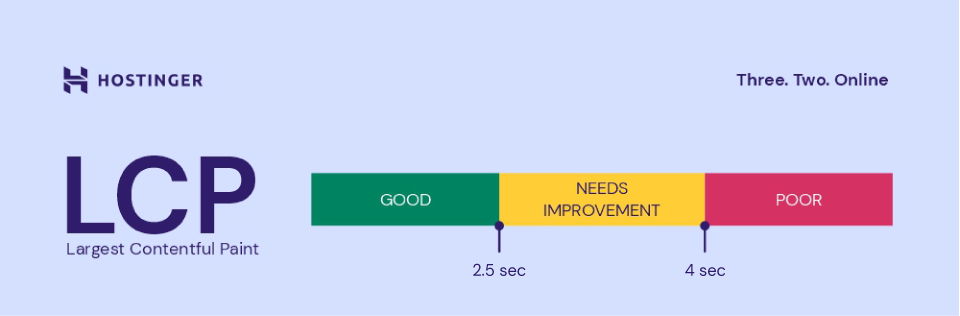
A page speed between 2.5 and 4 seconds is still acceptable, but you need to tweak some elements to improve performance. Anything over 4 seconds leads to poor user experience, and you may lose many visitors.
Expert tip
On our own site, we saw a significant improvement in traffic after reducing our load time to under two seconds. This was achieved by compressing images, fine-tuning our caching strategy, minimizing JavaScript, and using a content delivery network (CDN).
Sean Begg Flint
Founder & Director of Position Digital
Interaction to Next Paint (INP)
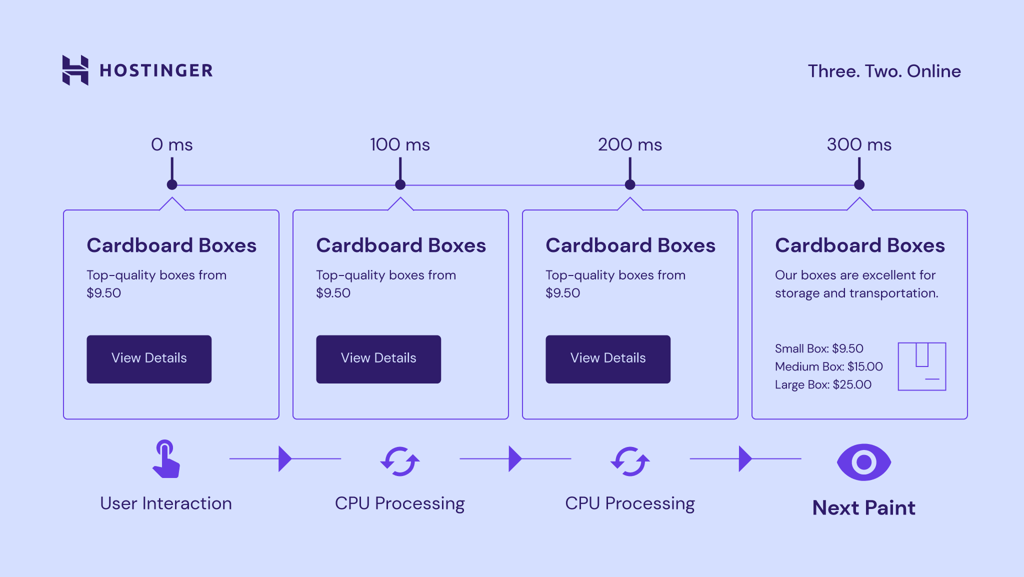
Interaction to Next Paint determines a page’s responsiveness. It measures how long it takes for your site’s elements to react to a user action, such as clicking a button or opening hidden content.
INP is measured in milliseconds (ms); the lower your INP score, the better. Ideally, your page content should respond to user requests in under 200 ms.
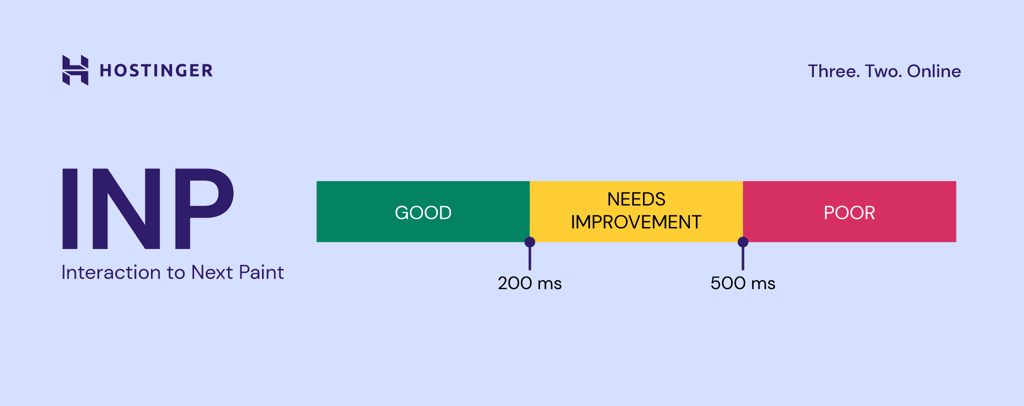
Your site needs improvement if your INP score is between 200 and 500 ms. Anything beyond 500 ms is considered unsatisfactory.
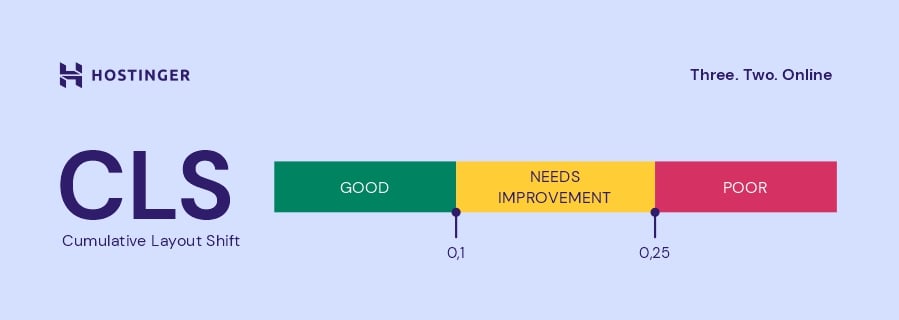
Cumulative Layout Shift (CLS)
Cumulative Layout Shift measures visual stability or the number of unexpected layout shifts that occur during user interactions, including elements appearing, resizing, or repositioning.
An example of an unexpected layout shift is an ad banner that suddenly appears when users are about to click a link or read a blog post.
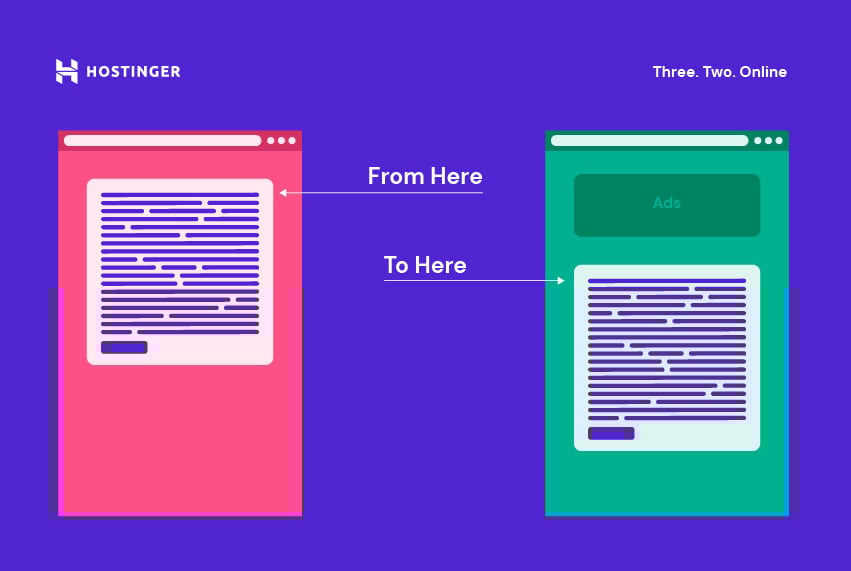
This disruption can cause users to click the wrong URL or spend more effort trying to find the text they were reading.
That’s not exactly a pleasing browsing experience, isn’t it?
If you want visitors to stay, aim for a CLS score of 0.1 or less. This indicates that your page content is very stable and that there are little to no unexpected element changes.
A CLS score between 0.1 and 0.25 means your page’s visual stability needs fixing. Any layout shift score above 0.25 suggests that your page elements move around a lot, which is bad for the overall user experience.
How to measure Core Web Vitals
We’ve discussed the score benchmarks for different Core Web Vitals metrics, but how do you measure them exactly?
No need to worry! You can use free tools like Google Search Console and PageSpeed Insights to check your Core Web Vitals data.
Google Search Console
Google Search Console (GSC) gathers data from the Chrome User Experience Report (CrUX), which reflects how real users interact with your site.
Once you’ve connected your site with Search Console, you can find the Core Web Vitals report by navigating to Experience → Core Web Vitals on the left sidebar.
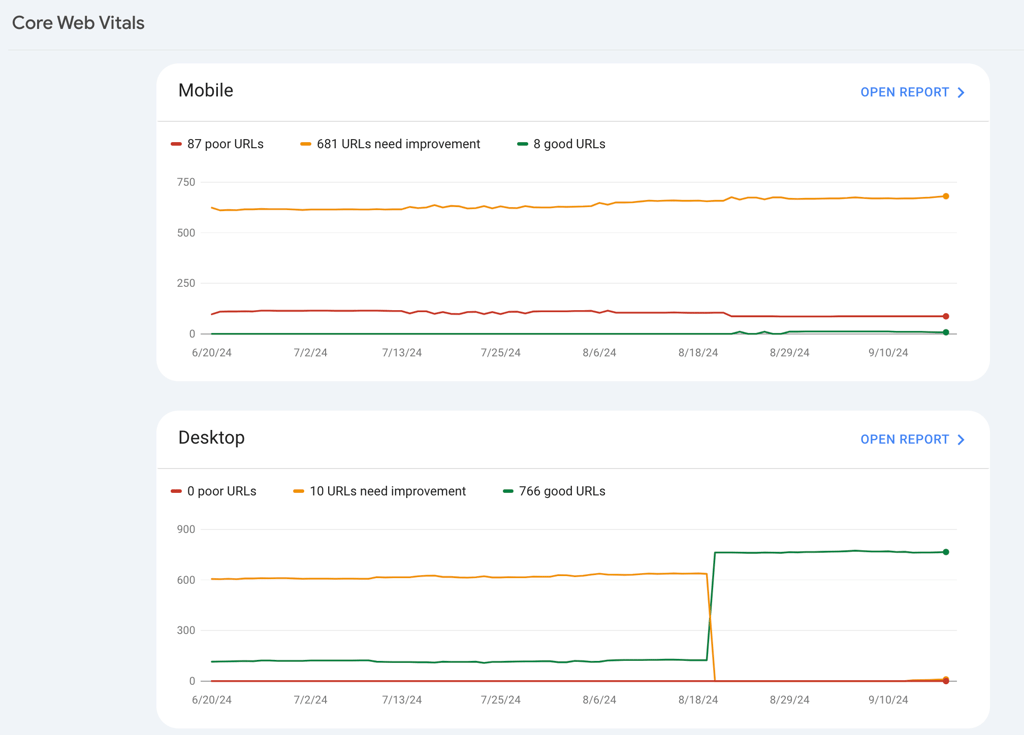
As you can see, Search Console allows you to check the performance of all your web pages altogether. This is something you can’t do with other online tools out there.
Access Open Report next to Mobile and Desktop to see how your site performs on both devices. When you scroll down, you will find more details regarding each Core Web Vital issue on your website.
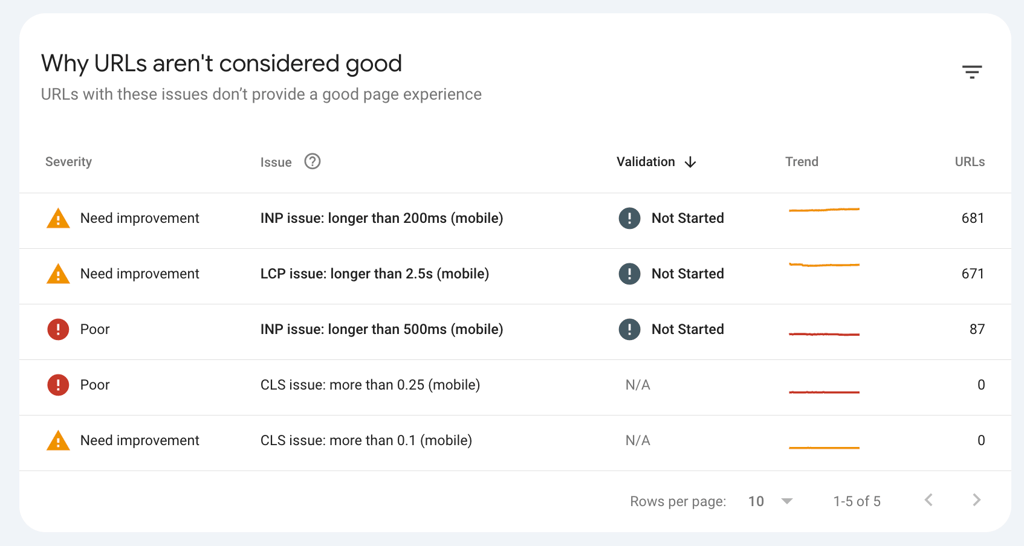
Under Why URLs aren’t considered good, click on one of the issues to see which URLs are affected by a low-performance score.
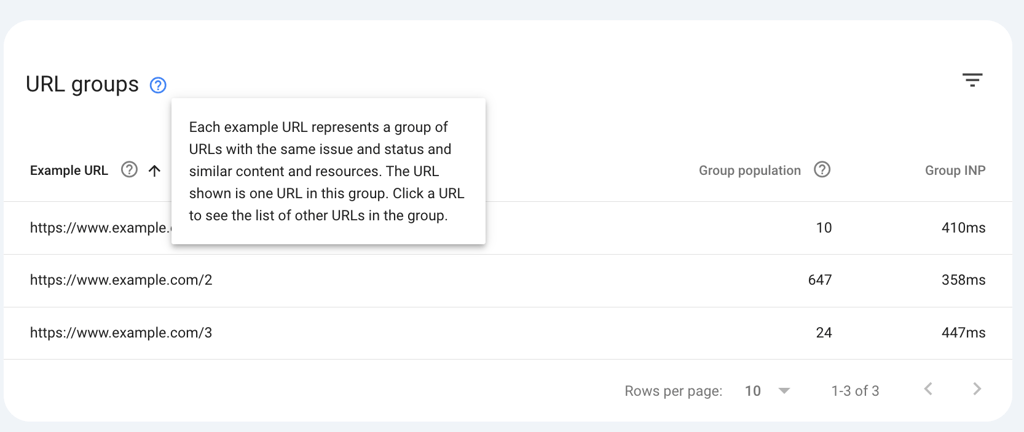
You won’t be able to check every page on your website individually. Instead, GSC groups several web pages with shared issues, so you’ll know what changes you have to implement site-wide.
PageSpeed Insights
If your site’s performance data isn’t available in the Search Console yet, or if you want to analyze a specific web page, consider using PageSpeed Insights.
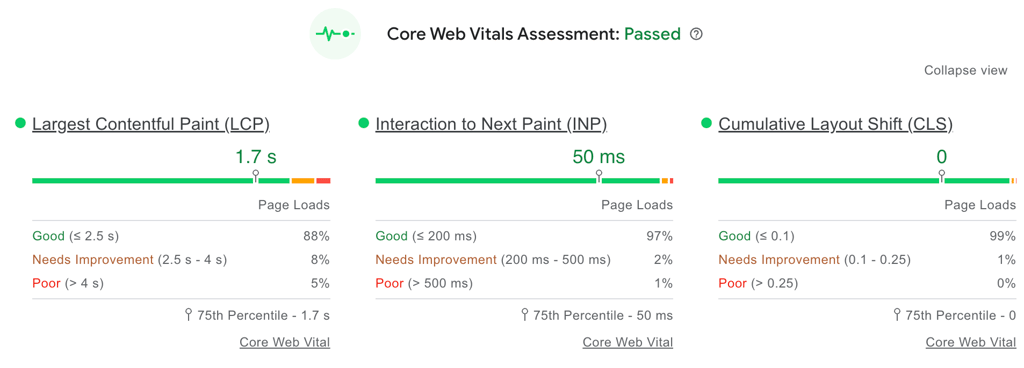
Simply type in the URL you want to check and click Analyze. The tool will display score bars for several core metrics and whether your web page passes or fails the Core Web Vitals assessment.

You can change between the Mobile and Desktop tabs to see the analysis from each device. Click Expand View to see more detailed scores of each Core Web Vital metric.
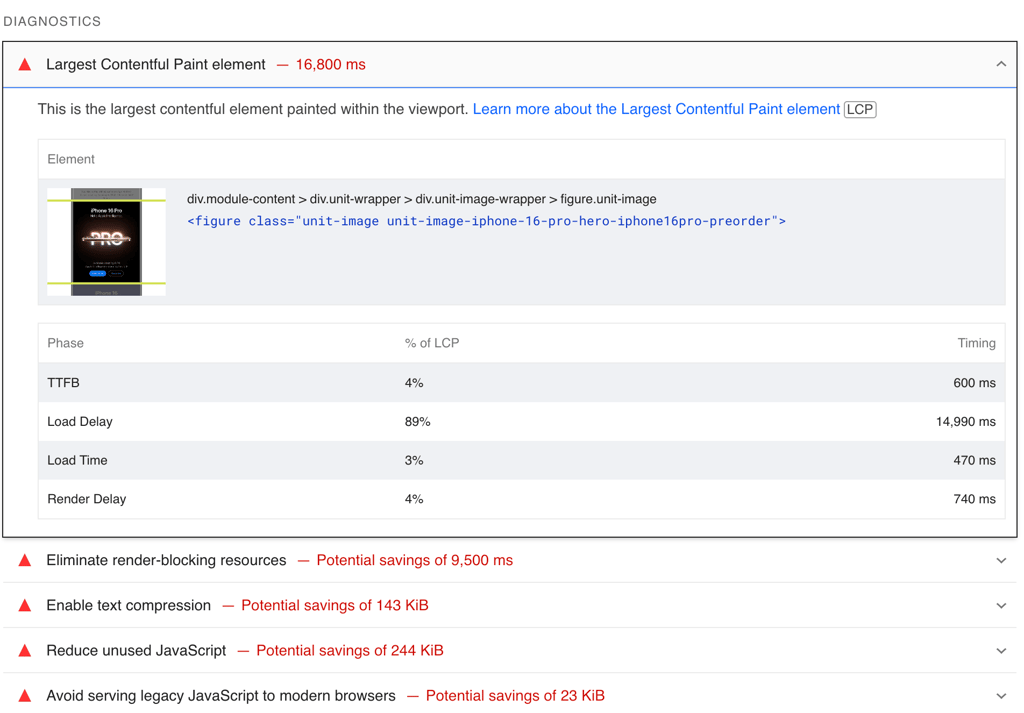
Scroll down to Diagnostics to find suggestions for improving the page’s performance.
In the example below, the tool detects that the iPhone 16 Pro image is the LCP element on Apple’s homepage.
If you’re a Hostinger user, you can quickly perform a website speed test and see your performance score directly in hPanel.
To do so, head to Websites → Dashboard. Then, select Performance → Page Speed on the left menu.
How to improve Core Web Vitals
If you’re not happy with your current performance, we’ve prepared a list of best practices you can do to improve your CWV scores.
While there are easy fixes you can do yourself, you may need the help of a professional developer for some of the more technical issues.
Improving Largest Contentful Paint
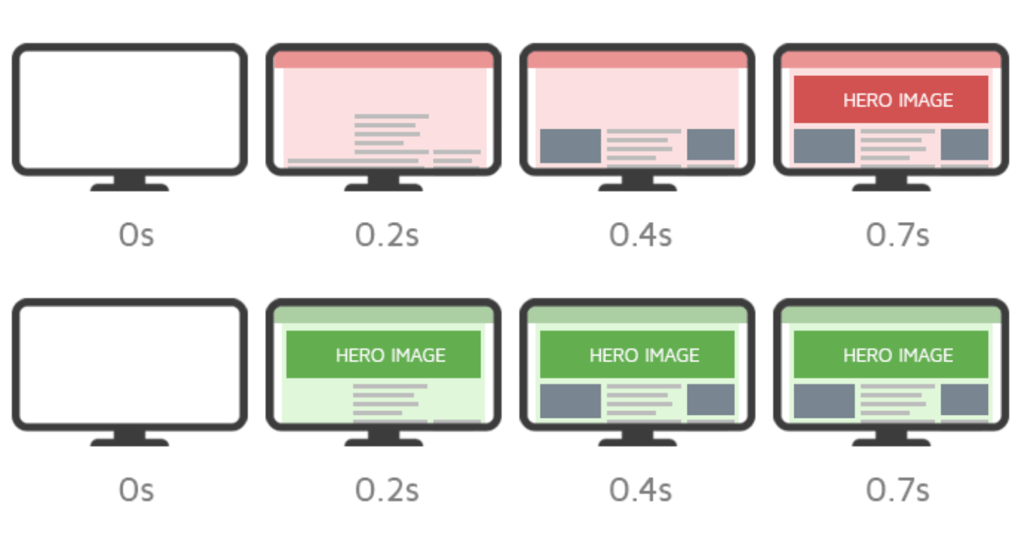
The most effective way to boost your LCP score is to preload the largest content on your web page, such as your hero image.
By doing so, visitors will be able to consume the complete version of your page much sooner, resulting in a better user experience.
To preload your largest image, add this code snippet to your site’s HTML header:
<link rel="preload" href="image/path/placeholder.jpg" as="image">
Replace image/path/placeholder.jpg with the actual URL of the image you want to preload.
Need help editing your HTML file? If you have a WordPress website, you can use a plugin like Head & Footer Code to simplify the process.
Once the plugin is installed, follow these steps:
- Go to Tools → Head & Footer Code.
- Scroll down to Article specific settings, and check the Posts and Pages boxes. Save your changes.
- Open the post or page you want to optimize.
- Set the Behavior to Replace the site-wide code.
- Enter the preload code above under Head Code.
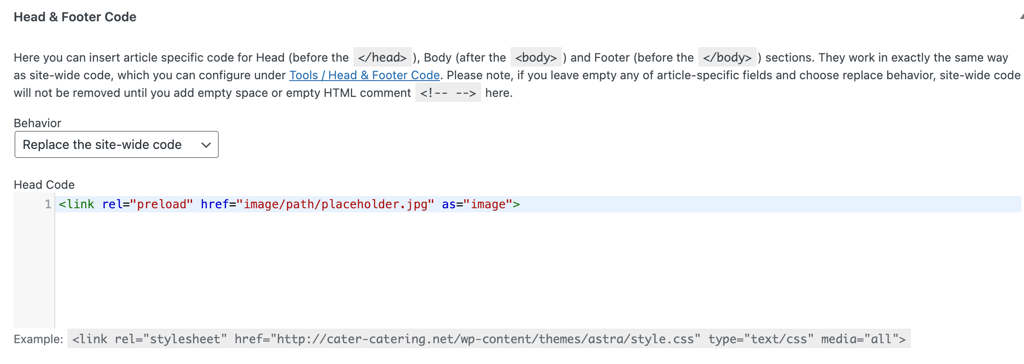
After publishing the post or page and checking the HTML file, you’ll notice that the preload tag has already been added.

Besides your largest content, you need to optimize other images on your website to boost its performance. Use free tools like TinyPNG to compress JPEG, PNG, and WebP images before uploading them to your site.
Upgrading your web hosting plan to a more robust service, such as cloud hosting, can also effectively improve your LCP score.
For instance, our cloud hosting solutions provide 20 times more server resources than shared hosting, offering your site greater computing power to manage large multimedia content efficiently.

Each cloud hosting plan comes with a content delivery network (CDN). It stores copies of your site’s content across a global network of servers.
In other words, when someone visits your site, the content will be delivered from the closest CDN server. Since the data travels through a shorter distance, the user can consume your content much faster.
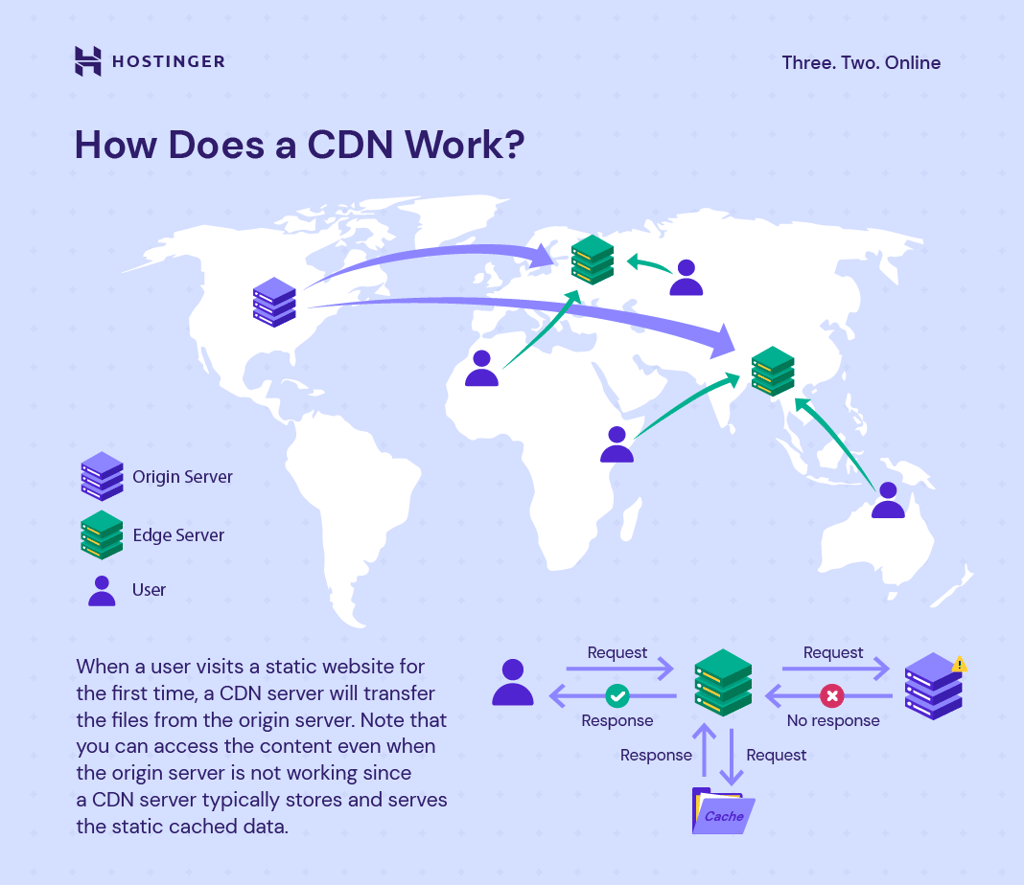
Our testing results showed that Hostinger’s CDN can increase your site’s performance by up to 40%.
Improving Interaction to Next Paint
A heavy front end JavaScript script is a common cause of page unresponsiveness. The web browser gets occupied with loading JavaScript files, leaving it with insufficient time to respond to user interactions.
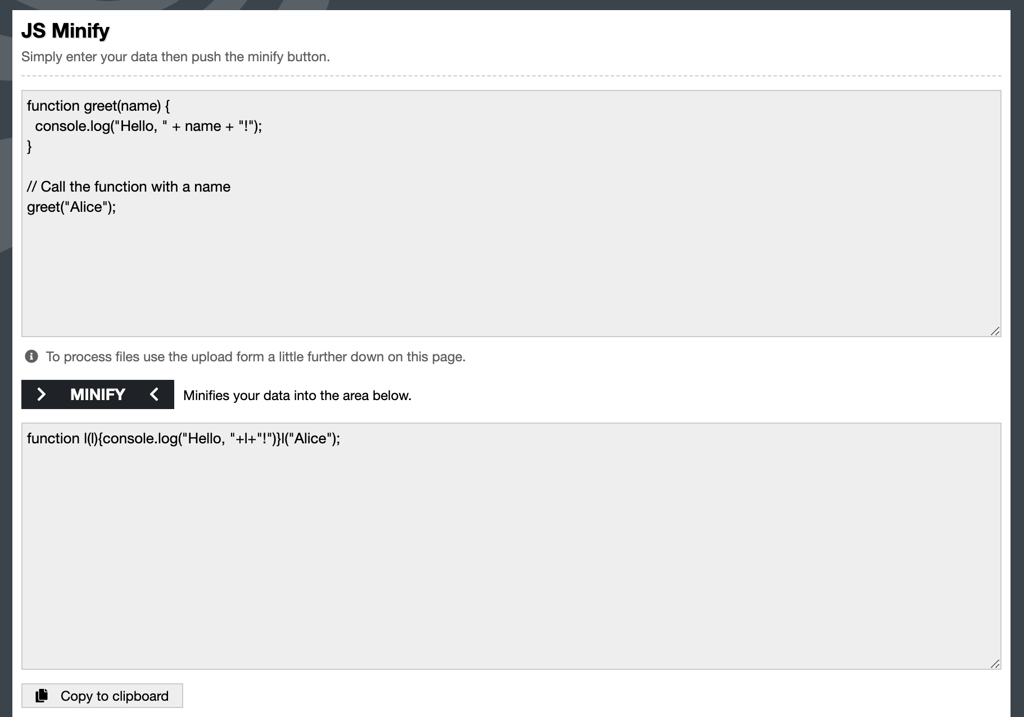
The most logical solution is to minify JavaScript using tools like UglifyJS.
Minification means removing unnecessary elements from your scripts, such as eliminating white space, using simpler formats, and shortening function names.
Apart from minification, it’s also a good idea to defer the loading of JavaScript. This technique will not load all JS files until other elements on your page are ready.
Moreover, remove any unused third-party code that can prevent browsers from loading your content quickly. This includes tracking scripts from Google Analytics or Hotjar that you no longer need.
If you’re a complete beginner, consider hiring a web developer to perform all these fixes. Playing around with code can quickly become confusing.
You don’t want to mess up your site’s code, do you?
For those running a WordPress site, check out our tips on how to choose and hire the right WordPress developer.
Improving Cumulative Layout Shift
Unexpected layout shifts usually occur because the browser can’t predict the final size of multimedia content on the page, such as banners, images, and videos.
So when the image or banner finally loads, it will move around every element within touching distance.
The easiest way to avoid this issue is to set a fixed dimension for your visuals.
Since your web browser knows exactly the height and width of your image, it can reserve the appropriate space on the page, keeping everything aligned properly.
You can add size attributes to images by adding this code snippet to your HTML file:
<img src="image-name.jpg" width="1140" height="1140" alt="Image description">
Simply replace the placeholders with your image’s actual name, width, height, and alt text description.
WordPress users can also use WP Rocket to add missing image dimensions to cached pages automatically.
Other website performance metrics
Besides the three primary metrics of Core Web Vitals, website owners also need to consider other web vitals to deliver a great user experience:
- First Contentful Paint (FCP). Calculates the time gap between the user arriving on your page and the first content being displayed. Content here includes text, images, and non-white canvas. To provide a good user experience, aim for an FCP score of 1.8 seconds or less.
- Time to Interactive (TTI). Measures the amount of time a page needs to become fully interactive, meaning that users can actually click a button or hover over an image. A good TTI score is less than 5 seconds.
- Total Blocking Time (TBT). It’s the total period when a page is blocked from responding to user input. A TBT score of 200 milliseconds or less indicates a page’s high responsiveness.
- Time to First Byte (TTFB). Specifies how fast your web server responds to a request and sends data to a user’s browser. Generally, a TTFB of 0.8 seconds or less is considered good. If you run a WordPress site, here’s how to reduce your server response time.
Conclusion
Core Web Vitals set the benchmark for your page’s user-friendliness. The better your site’s user experience, the more likely visitors will stay and engage with your content.
Moreover, Google includes Core Web Vitals in its ranking system. If you want to rank high on the SERPs, improving CWV scores should be your top priority.
There are three primary metrics of Core Web Vitals:
- Largest Contentful Paint (LCP). Calculates the amount of time your page takes to load the largest content.
- Interaction to Next Paint (INP). Measures your page responsiveness when users interact with your content.
- Cumulative Layout Shift (CLS). Checks the amount of unexpected layout shifts that occur during user interaction.
Each of these metrics has a certain threshold that determines whether your page performs well, needs improvement, or delivers a poor performance.
To check your site’s Core Web Vitals scores, use tools like Google Search Console and PageSpeed Insights.
We hope this article has helped you better understand what Core Web Vitals are, how to measure them, and how to improve your site performance for better search rankings.
Core Web Vitals FAQ
Have other questions? Here, we’ll answer some commonly asked queries about Core Web Vitals.
How do Core Web Vitals impact SEO?
Google has confirmed that Core Web Vitals are a ranking factor. That means if your site has good Core Web Vitals, it will have a better chance of ranking high on search results.
What happens if you fail Core Web Vitals?
Having a slow, unresponsive, and unstable website is bad for your brand reputation and user satisfaction. If you fail to fix these issues immediately, you’ll start seeing higher bounce rates, lower search rankings, and, eventually, reduced sales.
Are Core Web Vitals still relevant?
Yes, absolutely. Google is pushing sites to be more user-friendly, and Core Web Vitals provides unified guidance for site owners and developers to continue improving their websites’ performance.

Brian is a Content Writer who loves telling complex stories in a simple way. He has written all types of content, including tutorials, blog posts, landing pages, social media posts, white papers, infographics, and YouTube scripts. Follow him on LinkedIn.
Comments
0 responses