Node.js performance optimization: 12 ways to speed up apps
May 15, 2026
/
Alma
/
14 min Read

Node.js performance optimization means finding and fixing the parts of your app that slow it down, so it can respond faster, handle more traffic, use resources more efficiently, and stay stable under load.
The best approach is to measure first, then fix what the data shows you. Without measurement, you won’t know whether the problem is a blocked event loop, heavy middleware, large API responses, repeated database queries, missing indexes, memory leaks, or CPU-heavy work on the main thread.
Tools like profilers, load testers, and APM software show you what your app is actually struggling with.
Once you have a baseline, focus on the fixes that match your bottlenecks:
- Use async code to keep the event loop free
- Clean up Express middleware and shrink API payloads
- Cache repeated queries and expensive calculations
- Speed up database calls with indexing and connection pooling
- Use streams instead of loading large files into memory
- Move CPU-heavy tasks off the main thread
- Scale across CPU cores with clustering
- Tune memory settings and find leaks
- Remove unnecessary dependencies
- Serve static files through a CDN with compression
- Choose the right hosting environment
- Monitor production performance continuously
Most apps don’t need every optimization at once. Fix what profiling points to first, measure again, and move to the next bottleneck.
How to measure Node.js performance before optimizing
Measuring Node.js performance means profiling your app under realistic load, tracking key metrics, and comparing results before and after each change.
Start with the Node.js built-in profiler and Chrome DevTools. They can show whether your app is slowing down due to CPU-intensive code, memory pressure, or event loop blocking.
Run the built-in profiler with:
node --prof app.js
node --prof-process isolate-*.log > processed.txt
For a visual approach, start your app with:
node --inspect app.js
Then open chrome://inspect in Chrome.
If you need a clearer diagnosis, use Clinic.js. It’s a free set of tools for finding Node.js performance issues:
- Clinic Doctor shows whether the problem is CPU, I/O, memory, or event loop related
- Clinic Flame creates flame graphs so you can see which functions take the most time
- Clinic Bubbleprof helps you find slow async chains

After profiling, you’ll know which routes, functions, or operations are slow. To see how they hold up under heavy load, run a load test with a tool like Autocannon. It sends a high volume of requests to your app and reports response times, request counts, and errors.
To get useful results from load testing:
- Run tests on hardware close to production
- Warm up the app before measuring
- Change one thing at a time
- Watch database and external API limits so they don’t distort results
Once your app is live, keep measuring. APM tools like Datadog, New Relic, or AppSignal track route latency, database timing, errors, and resource usage under real traffic. They help you spot production issues, but they don’t replace deeper profiling when you need to inspect code-level bottlenecks.
For memory issues, use heap snapshots through Chrome DevTools or v8.writeHeapSnapshot(). Full snapshots can be expensive on live traffic, so take them in staging or during low-traffic periods.
Track these metrics before and after each optimization:
Metric | What it measures | What it helps you find |
Response time | Request duration from start to finish | Slow routes, heavy middleware |
Requests per second | Requests handled per second | Throughput limits |
CPU usage | Processor time used by the app | CPU-heavy code, blocking loops |
Memory usage (RSS) | Total memory the process holds, including native buffers | Memory leaks, large caches, native allocations |
Event loop delay | Delay between scheduled and actual callback runs | Blocking synchronous code |
Database query time | Query response time | Missing indexes, slow queries |
Error rate | Percentage of failed requests | Timeouts, unstable code paths |
What are the most important Node.js performance metrics?
The most important metrics are p95 and p99 latency, memory growth, CPU usage, event loop delay, database query duration, cache hit rate, and error rate.
Average response time is useful, but it can mask problems. A route might average 200ms while p99 requests take three seconds. p95 and p99 show the delays your slowest users actually experience during traffic spikes, which averages can miss.
If p95 or p99 latency is high, the other metrics help you trace slow requests back to likely causes:
- Memory that keeps rising points to a leak
- CPU spikes point to heavy computation on the main thread
- Event loop delay shows blocking code
- Database query duration and cache hit rate show repeated expensive work
- Error rate rising alongside traffic means your app is likely running out of resources
Check these regularly. When one changes, use it to decide which optimization to apply next. Start with code-level fixes, then move on to infrastructure and monitoring as needed.
1. Use asynchronous code to avoid blocking the event loop
Async code keeps the event loop available while your app waits for file operations, database queries, network requests, or external APIs.
Node.js runs JavaScript on a single main thread. When that thread is busy with synchronous work, other requests wait. Blocking code inside request handlers slows down the entire app.
Blocking typically comes from synchronous calls or heavy computation inside request handlers. If your event loop delay is high, check for these first:
- Synchronous file reads
- Expensive loops
- Large JSON parsing
- Synchronous encryption
- CPU-heavy processing inside request handlers
Compare a blocking file read with an async version:
// Blocking – other requests wait
const data = fs.readFileSync('/path/to/large-file.txt', 'utf8');
res.send(data);
// Non-blocking – the event loop stays available
const data = await fs.promises.readFile('/path/to/large-file.txt', 'utf8');
res.send(data);
The async version lets Node handle the file read outside the main JavaScript thread. While the file is being read, the event loop keeps handling other requests.
Use async/await and promise-based Node.js APIs (like fs.promises) as your default.
Modern database drivers like pg, mysql2, and Mongoose work the same way, handling I/O asynchronously, so waiting for the database usually won’t block the event loop. Large result sets and heavy response processing can still cause blocking, though, so keep queries and payloads small.
Async code solves I/O waiting, but not CPU-bound work. If a function spends 500ms crunching numbers, it still blocks the main thread even with await in front of it. Worker threads handle that by running the computation on a separate thread.
If your app uses synchronous calls inside request handlers, switching them to async versions can be one of the fastest wins.
2. Optimize Express middleware and API responses
Trimming your Express setup and API payloads cuts response time by removing work the server shouldn’t do on every request.
Middleware applied with app.use() runs on every matching request. If authentication, logging, body parsing, CORS, rate limiting, and compression all run globally, some routes may do work they don’t need. Move middleware to specific routes where possible:
// Instead of applying auth to every route
app.use(authMiddleware);
// Apply it only where needed
app.get('/dashboard', authMiddleware, dashboardHandler);
app.get('/public-page', publicHandler);
Now public routes skip authentication work entirely.
Next, look at what your API accepts and returns. Set a limit on incoming JSON payload size:
app.use(express.json({ limit: '100kb' }));
Adjust the limit based on what your API actually accepts. On the response side, return only the fields the client needs. Sending full database records when the frontend uses three fields wastes processing time and bandwidth.
Paginate large responses so endpoints can’t return thousands of records without a limit.
If you serve static files through Express, move them to a CDN or reverse proxy like Nginx. If a CDN or reverse proxy already handles compression, skip compression() in Express. Compress once, at one layer.
Even with all of this trimmed, response time depends on the full request chain: middleware, validation, database queries, external APIs, data formatting, and network transfer. Profile slow routes to find which part adds the most delay.
How can you reduce Node.js API response time?
You reduce API response time by fixing the slowest part of each route. The highest-impact fixes are:
- Remove unnecessary middleware from the route
- Return only required fields
- Paginate large results
- Cache repeated responses
- Optimize database queries
- Set timeouts for slow external requests
If a route waits five seconds for an external API, set a timeout and return a fallback when possible. Users get a controlled response instead of waiting until the request fails.
3. Cache frequently requested data
Caching reduces repeated database queries, external API calls, and expensive calculations. If a query takes 50ms and returns the same result many times, caching lets you run it once and serve later requests from cache.
For small, short-lived values on a single server, a simple in-memory cache is often enough. Keep it limited with a TTL or maximum size so it doesn’t grow into a memory problem.
Use Redis or Memcached when you run multiple processes, need shared cache across servers, or store session data outside the app process.
Cache type | Best for | Main benefit | Watch out for |
In-memory | Small, temporary values | Fast reads, no network call | Not shared across processes |
Redis/Memcached | Shared data, sessions | Works across instances | Adds a network hop |
CDN | Static files, public assets | Lower origin load and latency | Wrong headers serve stale files |
HTTP headers | Repeat visits, static assets | Controls how responses are reused | Misconfigured headers cache too much |
Whichever type you use, caching needs two settings: TTL and invalidation.
TTL (time to live) decides how long a cached value stays valid. A short TTL keeps data fresh but means more repeated work. A long TTL improves speed but risks serving stale data. Invalidation is how you remove or update cached values when the source changes.
Track cache hit rate. If 90% of requests are served from cache, your database handles only 10% of that work. If the hit rate stays low, the TTL may be too short, the cache keys too specific, or the data may change too often to cache well.
4. Optimize database queries and connection handling
Database calls are often one of the biggest sources of slow API responses because your app waits for the database before it can return a response.
Start with the highest-impact fixes:
- Select only the columns you need
- Avoid
SELECT * - Add indexes to frequently filtered, sorted, or joined columns
- Avoid N+1 queries
- Paginate large result sets
- Use connection pooling
- Check execution plans for slow queries
Compare an unoptimized query with a cleaner one:
// Slow – fetches every column and every row
const users = await db.query('SELECT * FROM users');

// Faster – only the fields and rows needed
const users = await db.query(
'SELECT id, name, email FROM users ORDER BY created_at DESC LIMIT 20'
);
On a table with, say, 100,000 rows and 30 columns, the first query makes your app fetch and send far more data than needed. The second returns 20 rows with three columns. With a useful index on created_at, the database can pull the most recent records without scanning the full table.
The query itself is only half the story. The other is how your app connects to the database. Without pooling, the app opens a new connection for each request, which adds delay and can overwhelm the database. A connection pool keeps connections ready and reuses them.
Most Node.js drivers, including pg and mysql2, support pooling. Tune the pool size based on traffic, database capacity, and the number of app instances. Too few connections cause requests to queue. Too many overload the database.
How do indexes improve Node.js application performance?
Indexes help the database find matching rows faster, which reduces query time and speeds up API responses.
If your login route looks up users by email, for example, an index on email helps the database find the matching row without scanning every record:
SELECT id, name, email
FROM users
WHERE email = $1;
Email values are typically unique or close to unique, so this type of index is often useful.
For paginated queries that filter and sort, a composite index like (active, created_at) may help, depending on the database and data distribution.
Don’t index every column. Indexes speed up reads but add write time and storage, because the database updates the index whenever rows change.
5. Use streams for large files and large responses
Streams process data in chunks instead of loading full files into memory. If you load a 500MB CSV file the normal way, for example, it takes 500MB of RAM. Streamed, it uses only a small buffer at any given time.
Avoid loading large files like this:
app.get('/download', async (req, res) => {
const data = await fs.promises.readFile('large-file.csv');
res.send(data);
});
Use a stream instead:
const fs = require('node:fs');
const { pipeline } = require('node:stream/promises');
app.get('/download', async (req, res, next) => {
try {
await pipeline(
fs.createReadStream('large-file.csv'),
res
);
} catch (err) {
next(err);
}
});
The streamed version starts sending data immediately and keeps memory lower because Node handles the file in chunks.
Streams also handle speed mismatches between sender and receiver, which is called backpressure. If a user has a slow connection, Node pauses reading until the response stream catches up. Use pipeline() for production code because it handles stream errors and cleanup better than .pipe().
In production, also check that the file exists, set the right headers, and handle client disconnects.
6. Reduce CPU-heavy work in the main thread
CPU-heavy tasks block the main thread, preventing the event loop from handling other requests. Async code does not fix this because the JavaScript engine still runs the computation on one thread.
Common CPU-heavy tasks include:
- Image processing
- PDF generation
- Encryption
- Compression
- Large JSON transformation
- Report generation
- Data-heavy calculations
Move heavy work off the main request path based on when and how the result is needed:
- Use worker threads when the user needs the result during the same request.
- Use background job queues when the task can be completed later, like report generation or email processing.
- Use external services when the workload is specialized or resource-heavy, such as video processing or machine learning.
For background jobs, use a queue like BullMQ with Redis so your API can respond quickly while another worker processes the task.
For CPU-heavy web tasks such as PDF generation, image resizing, or data transformation, worker threads and background queues usually let you stay in Node.js.
For workloads built around data science, machine learning, or numerical computing, it may be worth comparing Node.js vs. Python before deciding where that part of the system should run.
When should you use worker threads in Node.js?
Use worker threads when your app needs to run CPU-heavy JavaScript without blocking the main event loop, and the user needs the result in the same request.
Worker threads and clustering solve different problems. Worker threads handle CPU-heavy tasks inside a single process. Clustering runs multiple Node.js processes to handle more concurrent requests across CPU cores.
Say your app generates PDF invoices. The main thread can stay available while a worker handles the generation. This example creates one worker for clarity. In production, use a worker pool for repeated jobs:
const { Worker } = require('node:worker_threads');
function generatePDF(data) {
return new Promise((resolve, reject) => {
const worker = new Worker('./pdf-worker.js', {
workerData: data,
});
worker.on('message', resolve);
worker.on('error', reject);
worker.on('exit', (code) => {
if (code !== 0) {
reject(new Error(`Worker stopped with exit code ${code}`));
}
});
});
}
Creating a worker for every small task can cost more than the task itself. For short operations (a few milliseconds or less), keep them on the main thread.
7. Scale Node.js with clustering and load balancing
Clustering runs multiple Node.js worker processes across CPU cores, so your app can handle more concurrent requests.
How much you gain depends on the workload. I/O-heavy apps (like API servers waiting on databases) benefit more than CPU-heavy apps, where each worker still competes for processing power.
Either way, you rarely get a perfect 4x improvement on four cores because shared resources like the database, network, and OS scheduling still create limits.
The Node.js cluster module forks your app into multiple processes that share the same port. On most platforms, Node’s primary process distributes connections across workers using round-robin scheduling. PM2 makes this easier by adding process management, automatic restarts, monitoring, and zero-downtime reloads.
Beyond one server, a reverse proxy like Nginx or a load balancer can distribute traffic across multiple servers or containers. Docker and Kubernetes handle this at a larger scale.
Clustering helps with throughput, but it won’t fix slow queries, memory leaks, blocking CPU work inside each process, or missing caches. Four copies of a slow app are still slow, but they can handle more users at once.
Warning! If session data is stored only in process memory, clustering breaks sessions. Each worker has its own memory, so a user might hit a different worker on the next request and lose their session. Store sessions in Redis or another shared store instead.
What is the difference between clustering and load balancing?
Clustering runs multiple Node.js processes on one server to use more CPU cores. Load balancing distributes traffic across processes, servers, or containers.
Production apps often use both. Clustering fills the CPU cores on each server. Load balancing spreads traffic across servers for better availability and capacity.
8. Tune Node.js memory and garbage collection
Memory tuning reduces garbage collection pauses, prevents crashes, and keeps your app stable under sustained traffic. Most apps don’t need manual memory tuning unless memory becomes a problem.
V8, the JavaScript engine used by Node.js, manages memory automatically. Its heap includes two main areas:
- New Space – stores short-lived objects and is collected often.
- Old Space – stores objects that survive multiple garbage collection cycles and is collected less frequently.
High memory usage isn’t always a leak. It may come from normal growth under load, from large caches, from native buffers, or from fragmentation. A true leak means memory keeps growing because the app holds references to objects it no longer needs.
You can adjust V8 memory limits with:
node --max-old-space-size=4096 app.js
This raises the Old Space limit. Use it when your app genuinely needs more heap, not to hide a leak. The default depends on your Node.js version and available system memory. In containers, Node.js adjusts the limit based on container memory.
The --max-semi-space-size flag influences New Space. A larger value reduces how often short-lived objects get promoted to Old Space, which means fewer slow garbage collection runs. But changing it without profiling can make performance worse. Test with your actual workload first.
How can you find memory leaks in Node.js?
Memory leaks happen when your app keeps references to objects it no longer needs.
Common causes include:
- Global arrays or maps that keep growing
- In-memory caches without TTL or size limits
- Event listeners that are never removed
- Large objects stored in closures
- Timers that never clear
Use heap snapshots to compare memory over time:
const v8 = require('node:v8');
v8.writeHeapSnapshot();
Take one snapshot, run the app under load, then take another. Objects that keep growing between snapshots are candidates for leaks.
Monitor memory in production, too. If memory rises for hours or days and doesn’t drop after garbage collection, investigate. Load testing with Autocannon can make leaks appear faster in staging.
9. Reduce dependency and code overhead
Removing unnecessary dependencies and repeated operations can make your app start faster, use less memory, and reduce security risk. Many of these fixes are small cleanup tasks, not rewrites.
Check package.json first. Remove packages your app no longer uses. Then look for large packages doing simple tasks. If you use Lodash only for _.get(), optional chaining may be enough:
const city = user?.address?.city;
If you use Moment.js only for basic date formatting, Intl.DateTimeFormat or a smaller library like date-fns may cover what you need.
Dependencies aren’t the only source of wasted work. Your own code can repeat expensive operations too:
- Creating a new HTTP client for every outgoing request
- Reading and parsing the same config file on every request
- Compiling a regex inside a loop
// Wasteful – re-reads config on every request
app.get('/settings', async (req, res) => {
const config = JSON.parse(await fs.promises.readFile('config.json', 'utf8'));
res.json({ theme: config.theme });
});
// Better – read once at startup
const config = JSON.parse(fs.readFileSync('config.json', 'utf8'));
app.get('/settings', (req, res) => {
res.json({ theme: config.theme });
});
Synchronous reads are fine during startup because no requests are being handled yet. The problem is running them inside request handlers, where they can block other requests.
Keep the dependencies you do use updated. Newer versions often include performance fixes and security patches.
10. Use a CDN and compression for static assets
A CDN serves static files from locations closer to users, which reduces latency and lowers load on your origin server. Use it for JavaScript, CSS, images, fonts, and static downloads. Your Node.js app shouldn’t spend CPU time serving these when a CDN or reverse proxy can handle them.
Beyond location, file size also affects how fast assets load. Compression reduces file size before assets reach the browser. Gzip and Brotli are the main options.
Brotli compresses static files better than Gzip when you pre-compress them at build time. For dynamic responses compressed on the fly, Gzip is often faster because Brotli’s encoding takes more CPU.
Compress text-based assets like HTML, CSS, JavaScript, JSON, and SVG. Skip files that are already compressed, like JPEG, PNG, MP4, and ZIP, where compression adds CPU cost without much size reduction.
For images, use modern formats like WebP or AVIF when possible, and resize images to the dimensions users actually see. If you upload a 4000×3000 image but display it at 400×300, the browser still downloads the full-size file unless you serve a smaller version. Resizing at build time or through an image CDN saves bandwidth.
Once your files are compressed and properly sized, set long cache headers so returning visitors don’t download them again:
Cache-Control: public, max-age=31536000, immutable
Use cache-busting filenames like app.a3f2b1.js. This lets browsers cache files for a long time while still receiving updates when filenames change.
11. Choose the right hosting environment for Node.js performance
Hosting affects performance because CPU, RAM, storage speed, bandwidth, CDN access, and server region all determine how well your optimized app runs in production.
Optimizing your code makes the app faster. The right host makes sure that speed reaches your users. You need both.
The main decision is how much infrastructure you want to manage.
Factor | Managed Node.js hosting | VPS |
Server control | The platform handles most of the setup | Full root access |
Deployment | Git or file-based, lower complexity | SSH, manual setup |
Maintenance | Managed by the provider | You handle updates and patches |
Flexibility | Works within platform limits | Full control over runtime and server |
Best for | Standard apps, faster deployment | Custom stacks, Docker, PM2, Nginx |
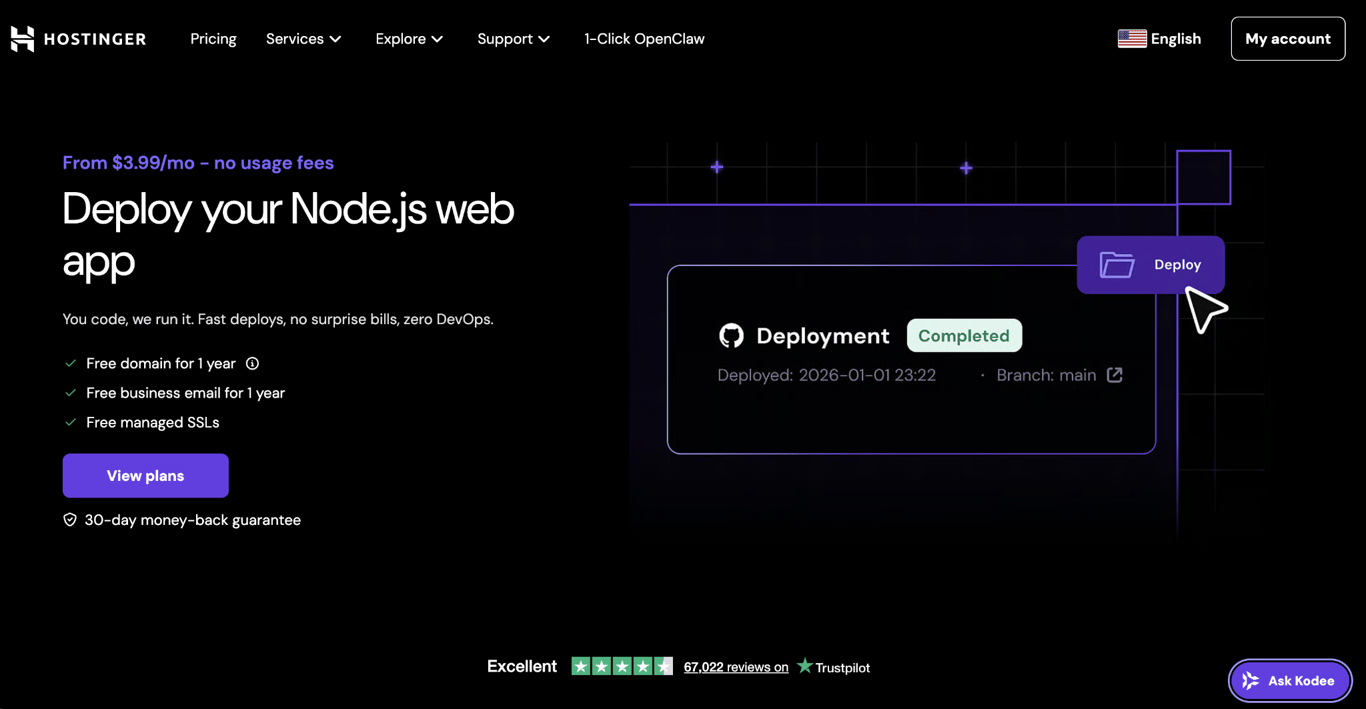
Node.js hosting from Hostinger is one managed option. It supports deployment via GitHub, CDN, SSL, and DDoS protection, so you can focus on shipping code instead of maintaining the server. Node.js hosting is available on Business and Cloud plans.
VPS hosting is better when you need root access, Docker workflows, PM2, Nginx, specific Node.js versions, or low-level performance tuning. The trade-off is that updates, patches, and security are on you.
You can deploy a Node.js application with either approach. Choose based on your app’s needs, not just price. Region, CPU limits, memory, scaling, and monitoring all affect the experience users get.

12. Monitor Node.js performance in production
Production monitoring catches problems that development testing misses: slow requests under real traffic, memory leaks, error spikes, and database queries that slow down as data grows.
APM tools like Datadog, New Relic, or AppSignal track route-level performance under real traffic. They won’t catch everything on their own, so pair them with structured logs, traces, error monitoring, and uptime checks.
For lighter setups, structured logging with Pino or Winston, along with uptime monitoring, covers the basics.
Set alerts for:
- p95 or p99 latency increases
- Memory grows continuously
- CPU stays high
- Error rate rises
- Database query time increases
- Cache hit rate drops
Start with conservative thresholds and adjust as you learn your app’s normal patterns. Noisy alerts get ignored. Targeted alerts catch problems early.
When metrics show something is slow, apply the relevant fix and measure again.
Node.js performance optimization checklist
Use this checklist after profiling your app. Start with the items connected to the bottlenecks you found, then revisit the rest as traffic, features, and infrastructure change:
- Measure baseline performance before changing code
- Profile slow routes to find what’s actually slow
- Check p95 and p99 latency, not only averages
- Replace synchronous operations inside request handlers
- Move route-specific middleware off the global stack
- Limit incoming JSON payload size
- Return only the fields each endpoint needs
- Paginate large list responses
- Compress text-based responses at one layer only
- Cache repeated queries and expensive calculations
- Track cache hit rate
- Add indexes for frequent filters, joins, and sorting
- Avoid N+1 queries
- Use database connection pooling
- Use streams for uploads, downloads, and large exports
- Move CPU-heavy work to worker threads or background queues
- Scale across CPU cores with clustering
- Store sessions in a shared store when clustering
- Check memory growth before tuning heap flags
- Remove unused dependencies
- Serve static files through a CDN or reverse proxy
- Monitor latency, errors, CPU, memory, database timing, and cache performance
What to do after optimizing Node.js
Node.js performance optimization doesn’t end after one round of fixes. New features, traffic growth, dependency updates, and database growth can all create new slowdowns over time.
Once you’ve fixed the main performance issues, review the rest of your production setup: error handling, security, dependency management, environment configuration, logging, testing, and deployment workflows.
These areas may not always affect speed directly, but they play a big role in how reliably your app performs in production. A fast app still needs clear logs, safe configuration, stable dependencies, and predictable deployment processes to stay healthy as traffic and complexity grow.
Following best practices for Node.js development helps keep your app maintainable, secure, and production-ready as it grows. Keep measuring, fix the slowest bottleneck first, and repeat.

Alma is an AI Content Editor with 9+ years of experience helping ideas take shape across SEO, marketing, and content. She loves working with words, structure, and strategy to make content both useful and enjoyable to read. Off the clock, she can be found gaming, drawing, or diving into her latest D&D adventure.