The Hostinger Monitoring Mystery Revealed

Back when Hostinger was still a small company, only Nagios, Cacti, and Ganglia existed in the market as open-source monitoring tools. They’re less known now, but Nagios and Cacti are still being developed.
Even though no automation tools existed. Bash + Perl did the job. If you want to scale your team and yourself, automation should never be ignored. No automation means more manual work.
We started out with around 150 physical servers. To compare, we currently have around 2000 servers, including internal purpose VM’s and physical boxes.
All of the aforementioned tools (Nagios, Cacti, and Ganglia) mostly used the SNMP protocol, which in my opinion is horrible.
For networking gear, SNMP is still usable worldwide, but currently, with white-box switches, it’s becoming unnecessary.
Instead, run _node_exporter_ or any other exporter inside the switch and expose whatever you need in a human-readable format.
We use CumulusOS which in our case is mostly x86 architecture, thus it is absolutely not a problem to run any kind of Linux stuff.
In 2015 when we started automating everything that can be automated, we introduced the Prometheus ecosystem. In the beginning, we had a single monitoring box where Alertmanager, Pushgateway, Grafana, Graylog, and rsyslogd were running.
During the transition period from the old monitoring stack (NCG – Nagios/Cacti/Ganglia), we used both systems. Now, we rely only on Prometheus.
The new setup improved our resolution time from 5 minutes to 15 seconds, which allows us to have a fine-grained deep analysis. Even MTTD (mean time to detect) was reduced by a factor of 4.
We have about 25 community metric exporters as well as some custom-written ones like _lxc_exporter_ in at our disposal. We mostly expose custom business-related metrics using a textfile collector.
We also evaluated the TICK (Telegraf/InfluxDB/Chronograf/Kapacitor) stack as well. We were not happy with it because of limited functionality at that time – Prometheus looked simpler in many ways and more mature to implement.
Later in 2017, we started using PagerDuty for paging. We have a weekly 24/7 on-call rotation. In our case, we rotate every fifth or sixth week only, which is quite comfortable. But we are looking forward to eliminating this duty as a whole. Instead, we will take care of the service we own, because the owner knows the problems best.
Last year as we grew our infrastructure N times since 2015, the main bottleneck become Prometheus and Alertmanager. Our Prometheus uses up about ~2TB of disk space. If we restart or push the node using knife we miss monitoring data for a while. A Prometheus restart takes about 10-15 minutes – not acceptable.
Another problem is that if a single location is down we miss monitoring data as well. Thus we decided to implement a highly available monitoring infrastructure: two Prometheus nodes and two Alertmanagers in separate continents.
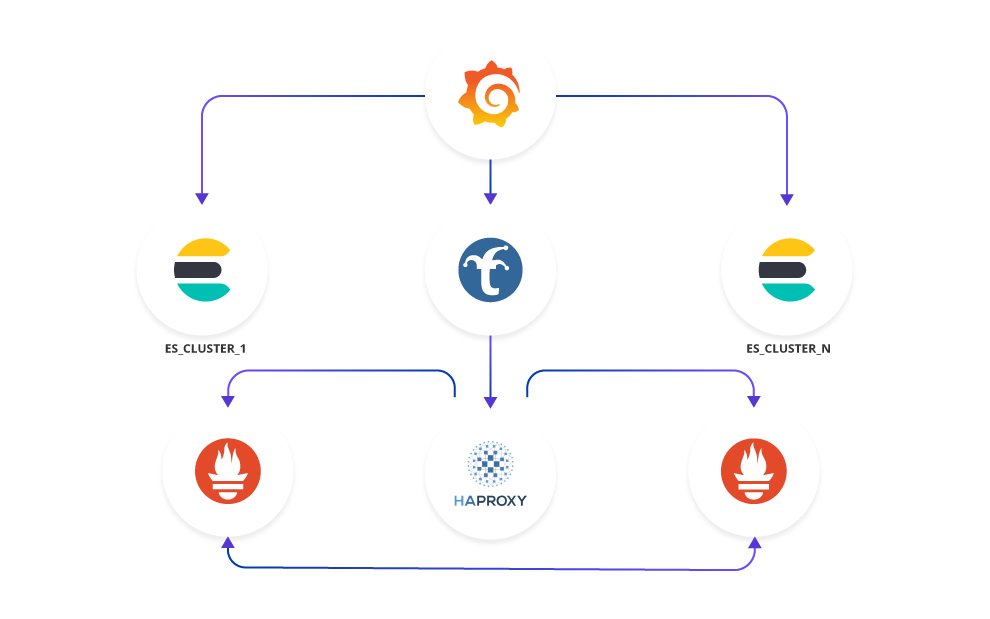
Our main visualization tool is Grafana. It’s critically important that Grafana could query the backup Prometheus node if the primary is down. This is easy – simply put an HAProxy in front and accept connections locally.
backend prometheus
  server prometheus_2a02_4780_9__1234 2a02:4780:9::1234:9090 check fall 3 rise 2
  server prometheus_2a02_4780_bad_c0de__1234 2a02:4780:bad:c0de::1234:9090 check fall 3 rise 2 backup
  option httpchk GET /graph
  http-check expect rstatus (2|3)[0-9][0-9]
The performance of middleware measured single-digit milliseconds – all good.
Another problem is to figure out how we can prevent users (developers and other internal staff) from abusing dashboards overloading the Prometheus nodes. Or the backup node if the primary one is down – the thundering herds problem.
To achieve the desired state we gave Trickster a chance. It speeds up dashboard loading times incredibly. It caches time series. In our case, the cache sits in memory, but there are more options for where to store it. Even when the primary node goes down and you refresh the dashboard, Trickster won’t query the second node for the time series that it has cached in its memory. Trickster sits between Grafana and Prometheus. It just talks with the Prometheus API.
Prometheus nodes are independent while Alertmanager nodes form a cluster. If both Alertmanagers see the same alert, they will deduplicate and fire once instead of multiple times.
We have plans to run plenty of _blackbox_exporters_ and monitor every Hostinger client’s website because anything that cannot be monitored cannot be accessed.